
9 Developing Scenarios
Strategic planning often requires the assessment of large numbers of future scenarios, each assessing a different combination of prioritizations, policy decisions, and constraints.
The VEScenarios module provides the capability to quickly set up, run, and visualize large numbers of VERSPM scenarios using a baseline scenario combined with multiple changes to model inputs.
After going to ../models/VERSPM_Scenarios folder, you will see multiple subfolders and scripts.
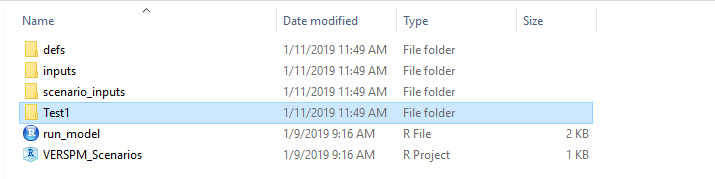
9.1 VERSPM Base Model
This directory contains the inputs and R script necessary to run the base scenario, as described above.
9.1.1 defs
VE-RSPM_Scenarios/defs directory contains the same files as the VERSPM_base_model/defs directory, but the model_parameters.json file differs between VERSPM_base_model/defs andVE-RSPM_Scenarios/defs differs in that the latter
version contains just four parameters specifying the locations of inputs and outputs, as well as the number of processors (NWorkers) to use. The default is 4, but be sure to set this to a number appropriate to your machine.
[
  {
    "NAME": "ModelFolder",
    "VALUE": "VERSPM_base_model",
    "TYPE": "character",
    "UNITS": "NA",
    "PROHIBIT": "NA",
    "SIZE": 20,
    "ISELEMENTOF": ""
  },
  {
    "NAME": "ScenarioInputFolder",
    "VALUE": "scenario_inputs",
    "TYPE": "character",
    "UNITS": "NA",
    "PROHIBIT": "NA",
    "SIZE": 20,
    "ISELEMENTOF": ""
  },
  {
    "NAME" : "ScenarioOutputFolder",
    "VALUE": "scenarios",
   "TYPE": "character",
   "UNITS": "NA",
   "PROHIBIT": "NA",
   "SIZE": 20,
   "ISELEMENTOF": ""
  },
  {
    "NAME" : "NWorkers",
    "VALUE": "6",
    "TYPE" : "integer",
    "UNITS" : "NA",
    "PROHIBIT" : "c('NA', '< 0')",
    "ISELEMENTOF" : ""
  }
]
9.1.2 Inputs
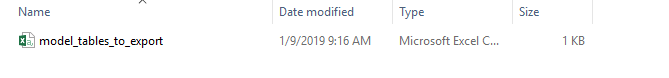
The inputs folder in VERRSPM_Scenarios also differs from that in VERSPM_base_model. In this case, there is only a single file specifying the output data tables that should be exported as CSV files in the outputs directory.
9.1.2.0.1 scenario_inputs
Model scenarios are defined in terms of combinations of individual model input parameters and policy choices. The various inputs are defined in the scenario_inputs folder.
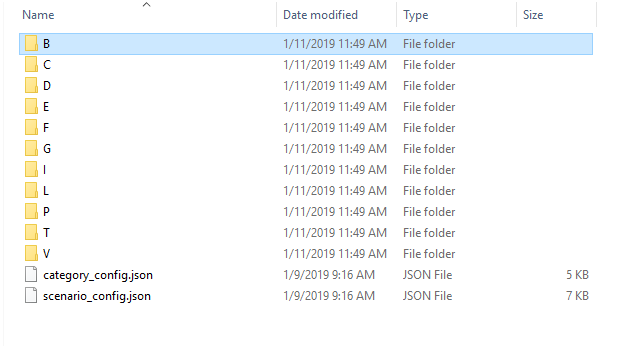
Scenario inputs consist of eleven folders, one for each of a particular category of input, as described below. All eleven folders are required.
Within each folder, there are subfolders containing input files, one per specific input. Each of the folders must contain at least one subfolder named “1”, defining the input for the base scenario. Subsequent numbered folders contain input files modifying parameters of interest, as shown in the screenshots below:
Model inputs not otherwise specified in the scenario_inputs directory are drawn from files in VERSPM_base_model/defs and VERSPM_base_model/inputs
The subfolder names and scenario inputs are defined as follows (input file to modify given in parentheses):
- B - Bicycles (
azone_prop_sov_dvmt_diverted.csv) : Network improvements, incentives, and technologies that encourage bicycling and other light-weight vehicle travel- 1 - Base bicycling percentage of SOV tours less than 20 miles (9.75%)
- 2 - Increase diversion of SOV tours to 20%
- C - Vehicle Travel Cost (
azone_hh_veh_own_taxes.csv) and (region_prop_externalities_paid.csv) : Combination of fuel prices and charges to pay for roadway costs and possibly externalities- 1 - No change in fuel prices or increase in roadway or externality charges
- 2 - Keep the vehicle ownership cost the same
- 3 - Higher climate cost and pay as you drive insurance
- D - DemandManagement (
bzone_travel_demand_mgt.csv) : Programs to encourage less private vehicle travel- 1 - Baseline implementation of ITS
- 2 - Increase the effectiveness of implementation of ITS
- E - Driving Efficiency (
marea_operations_deployment.csv) and (marea_speed_smooth_ecodrive.csv) and (other_ops_effectiveness.csv) : Driving efficiency by increasing implementation of ITS- 1 - Base
- 2 - Increased the proportion by 10%
- F - Technology Mix and CI (
marea_transit_powertrain_prop.csv) and (region_carsvc_powertrain_prop.csv) and (region_comsvc_powertrain_prop.csv`) : Vehicle technology mix and carbon intensity of fuels.- 1 - Baseline vehicle technology mix
- 2 - Increased percentage of electric vehicles in household and commercial setting by 20%
- G - Fuel Price (
azone_fuel_power_cost.csv) : Real fuel price in 2010 USD- 1 - Baseline fuel price
- 2 - Double fuel price
- 3 - Quadruple fuel price
- I - Income (
azone_fuel_power_cost.csv) : Real average household income in 2010 USD- 1 - Baseline household income
- 2 - Income growth of 7% w.r.t reference
- 3 - Income growth of 14% w.r.t reference
- L - LandUse (
azone_hhsize_targets.csv) and (bzone_urban_du_proportions.csv) : Distribution of population and employment by place type- 1 - Base, Maintain current distribution
- 2 - LU overlaps with HHsize + Population
- P - Parking (
bzone_parking.csv) : The extent of paid parking and its price- 1 - Current extent and daily fee
- 2 - Increase parking cost by 100% and proportion charted by 10%.
- T - Transit (
marea_transit_service.csv) : The extent and frequency of transit service- 1 - Current public transit service level
- 2 - Double public transit service level
- 3 - Quadruple public transit service level
- V - Vehicle Characteristics (
azone_hh_veh_mean_age.csv) and (azone_lttrk_prop): The combination of fuel prices and vehicle travel charges to pay for roadways and to pay for externalities such as carbon pricing- 1 - Base
- 2 - Light truck proportion at 35% of the fleet and the average vehicle age at 8 years
Running all of these input values will result in 10368 total scenarios, which would take days to run. User usually does not need all the possible combinations of scenarios.
VE-RSPM Scenarios are grouped in 5 different categories which you can modify in category_config.json :
- Community Design : Policies that seek to enable shorter trips and alternate modes such as promotion of mixed use land use, transit service, bicycling, and parking management. ( group of L, B, P , T )
- Marketing/Incentive : Policies that improve driving efficiency such as ecodriving,and Intelligent Transportation System efforts, as well as programs that reduce auto demand such as carsharing, and home or work-based transportation demand management.( group of D, E )
- Pricing : Policies that move towards true cost pricing such as road user fees to pay for the cost of operating, maintaining and improving roads, pay-as-you-drive (PAYD) insurance, and environmental impact fees such as a carbon tax. ( C )
- Vehicles/Fuels : Factors representing changes to future vehicles and fuels ( group of V, F )
- Income : Context factor on the assumed growth of statewide average per capita income ( I )
Depending on how many scenarios exist in each of these five groups, total number of scenarios will be determined.
To test the multi-scenario capability in less time, reduce the number of scenario inputs by deleting some of the numbered folders, making sure to retain the “1” folder for each of the six options.
Note that if you change the directory structure in scenario_inputs, you will have to change category_config.json and scenario_config.json to match the new directory structure.
To modify the scenario inputs, the numbered subdirectories can be created or deleted. Each directory contains a single input file containing the modified model parameter.
9.1.2.0.2 Running the model for multiple scenarios
Similar to base case the model can be run in the command line. To run the model using R, run the following commands:
scenario_rspm <- openModel('VERSPM_Scenarios')
scenario_rspm$run()
After starting the run,model automatically builds scenarios by creating all possible combinations of settings found in scenario_inputs. The scenarios to run are found in the newly created scenarios directory.
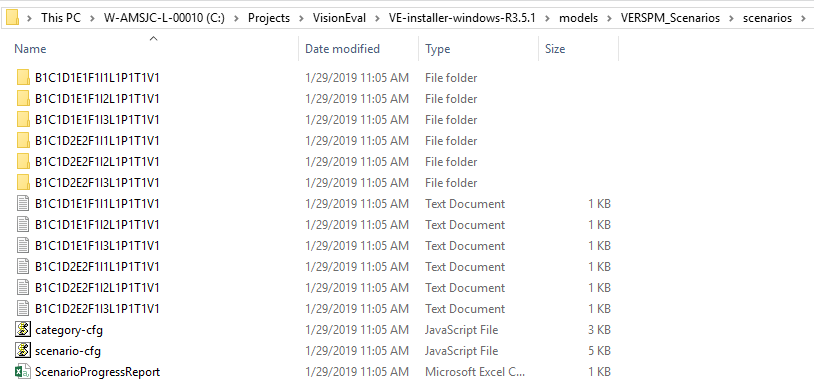
Each directory is essentially a copy of VERSPM_base_model, with inputs modified as specified in the scenario_inputs directory. Each scenario directory contains the results of a model run with its own inputs, datastore, and log file.
When finished, the VE-RSPM Scenario Viewer will automatically open to display the results.
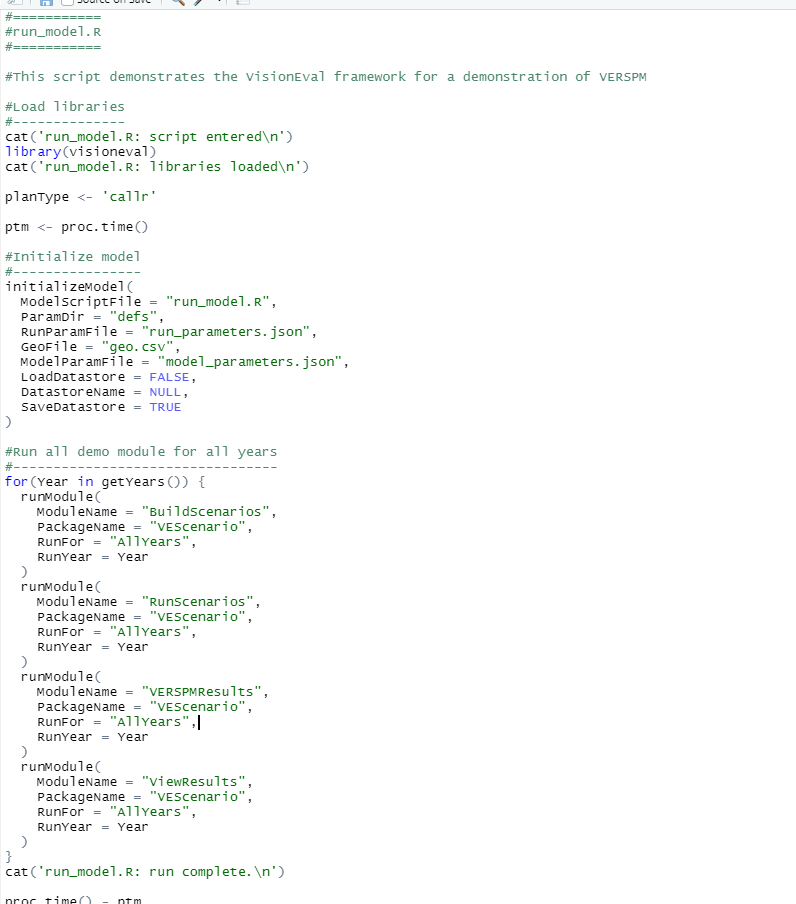
In detail, the model specified by the run_model.R script. In this case, the script runs four modules that create the scenarios from the inputs, runs each and combines the results.
9.2 Case Studies
9.2.1 Using VisionEval to Assess Bike Network Changes
A 2020 OregonDOT-Metro-NITC research project being led by Joe Broach of Portland State University, will update VisionEval code (VE-RSPM) to enable VisionEval to respond to bike networks as perceived by differnt users. This includes the following elements.
In the current VE-RSPM light vehicle (e.g. bicycle, electric bicycle, scooter) diversion module users specify the proportion of single-occupant vehicle (SOV) mileage diverted to light-vehicle travel in the base and future years. Historical value can be derived from household travel surveys bike usage; future year inputs are specified through aspirational goals or exploratory processes. Methods for generating realistic bicycle diversion input have not been established, and the inputs are hard to tie to specific investment actions. The exploratory or aspirational approaches can be useful for strategic planning purposes, providing decision makers with information about what levels of SOV diversion to bicycle travel are necessary to meet identified goals, but they do not offer information about the level of infrastructure or other transportation system investments needed to achieve the given levels of bicycle diversion.
The objective of the proposed research is to develop a new bicycle diversion module for the GreenSTEP-derived family of scenario planning models that internalizes bicycle diversion within the model by allowing users to specify changes in cycling infrastructure (and allow the model to estimate diversion), rather than assuming the outcome of cycling investments.
The research will develop new VE-RSPM modules to estimate SOV short-trip diversion, using input variables related to: 1. Socio-demographic and other household characteristics (drawing from existing variables in the model), 2. Land use characteristics (again drawing from existing variables in the model), and 3. Bicycle network characteristics.
Because VisionEval does not use an explicit network, bicycle network indicators will be used to represent the attractiveness of the bicycle facilities near the home location. The anticipated work includes pre-processors to extract bicycle network indicators from detailed bike network data, and potentially terrain data (from a digital elevation model) to capture the effects of hills on cycling propensity. Bicycle network indicators that may be included in VisionEval include the coverage, connectivity, and quality of bicycle facilities, and other measures shown in past research to have a significant relationship with cycling volumes, cycling mode share, or cycling attractiveness.
Several pre-processors are under consideration to develop connectivity and quality of bike networks, including: Bike Level of Traffic Stress (LTS)(see ODOT APMv2_Ch14), Highway Capacity Manual Multi-Modal LOS methods (see TRB), and Scalable-Risk Analysis Method (SCRAM).
The following figures highlight the selected changes that the model makes to the VE-RSPM packages and modules.

Bike Network Research
Note: The project also intends to synchronize the disaggregate Bike Network assumptions with the Bike Module in Portland Metro’s new Activity Based Model, where the full network, not just the aggregated metrics of VisionEval, could be utilized directly.
9.2.2 User Impact
The VisionEval Bike upgrades will change both methods, inputs and outputs. Methods will reflect the new functional form of travel by mode, and new data (updated NHTS2009 and EPA SLD land use data), leading to different outcomes for household travel by bike.
Users will likely need to provide more detailed bike network data (for historic and forecast years) to a pre-processor to develop Bzone inputs for use in VisionEval.