
11 VE-State Model Details
11.1 VE-State Vs. VE-RSPM
The main difference between VE-RSPM models and VE-State models is that a number of VE-RSPM inputs are specified at the Bzone level. The Bzones are sub-regional geographies, typically census tracts or block groups. Diagrams are available on the VisionEval wiki for a visual explanation of the VE-RSPM and VE-State geographies. Also, note that ‘Azones’ are typically counties, and ‘Mareas’ are metropolitan areas, typically defined by the boundaries of an MPO.
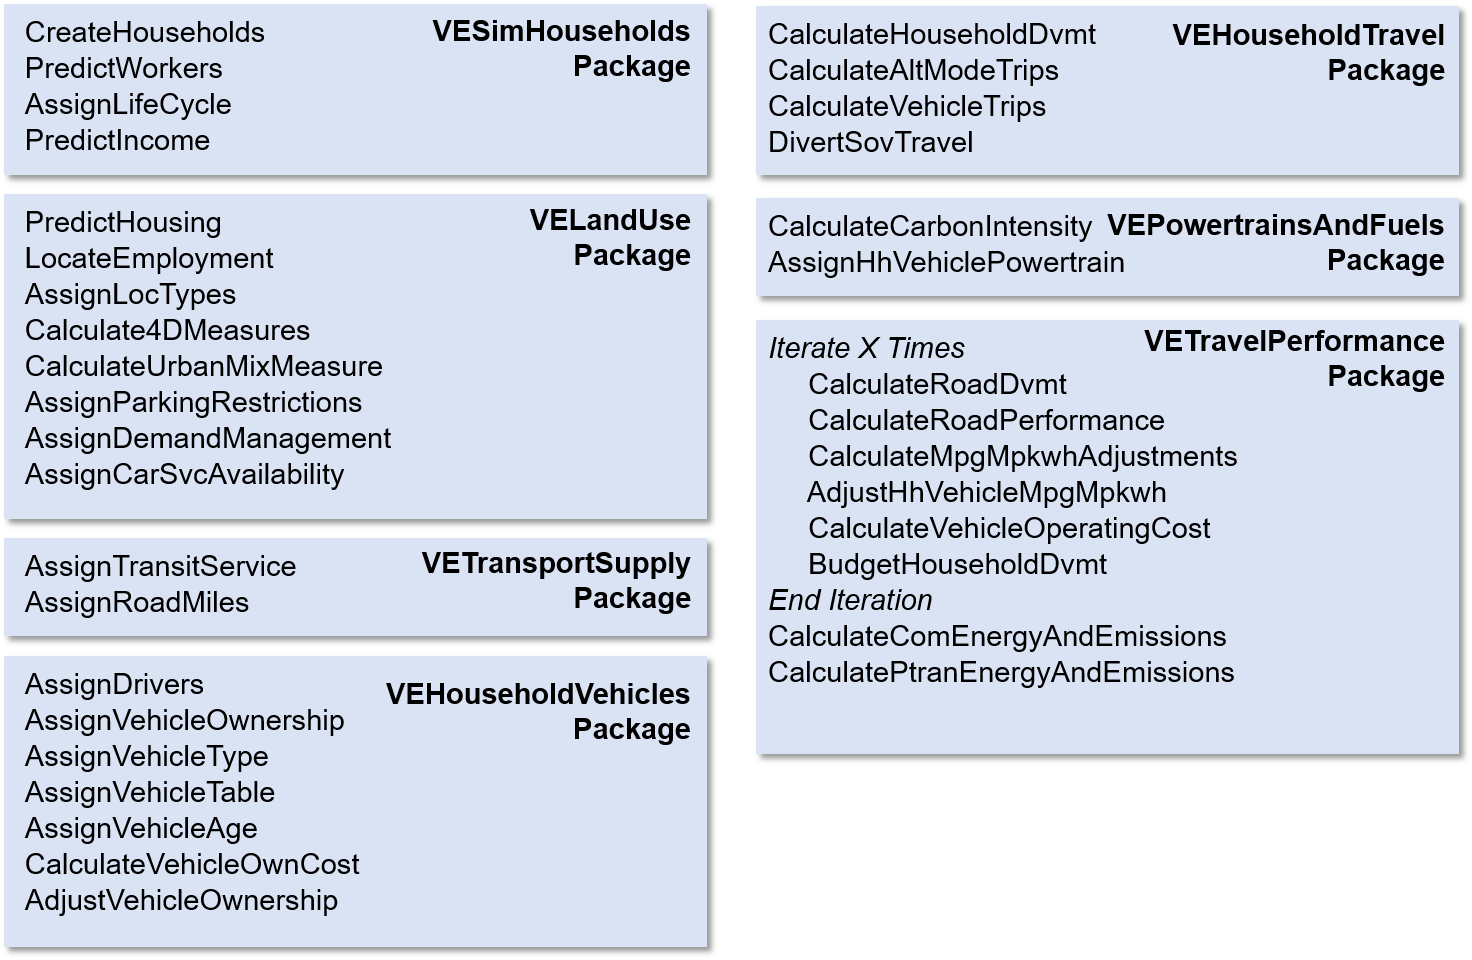
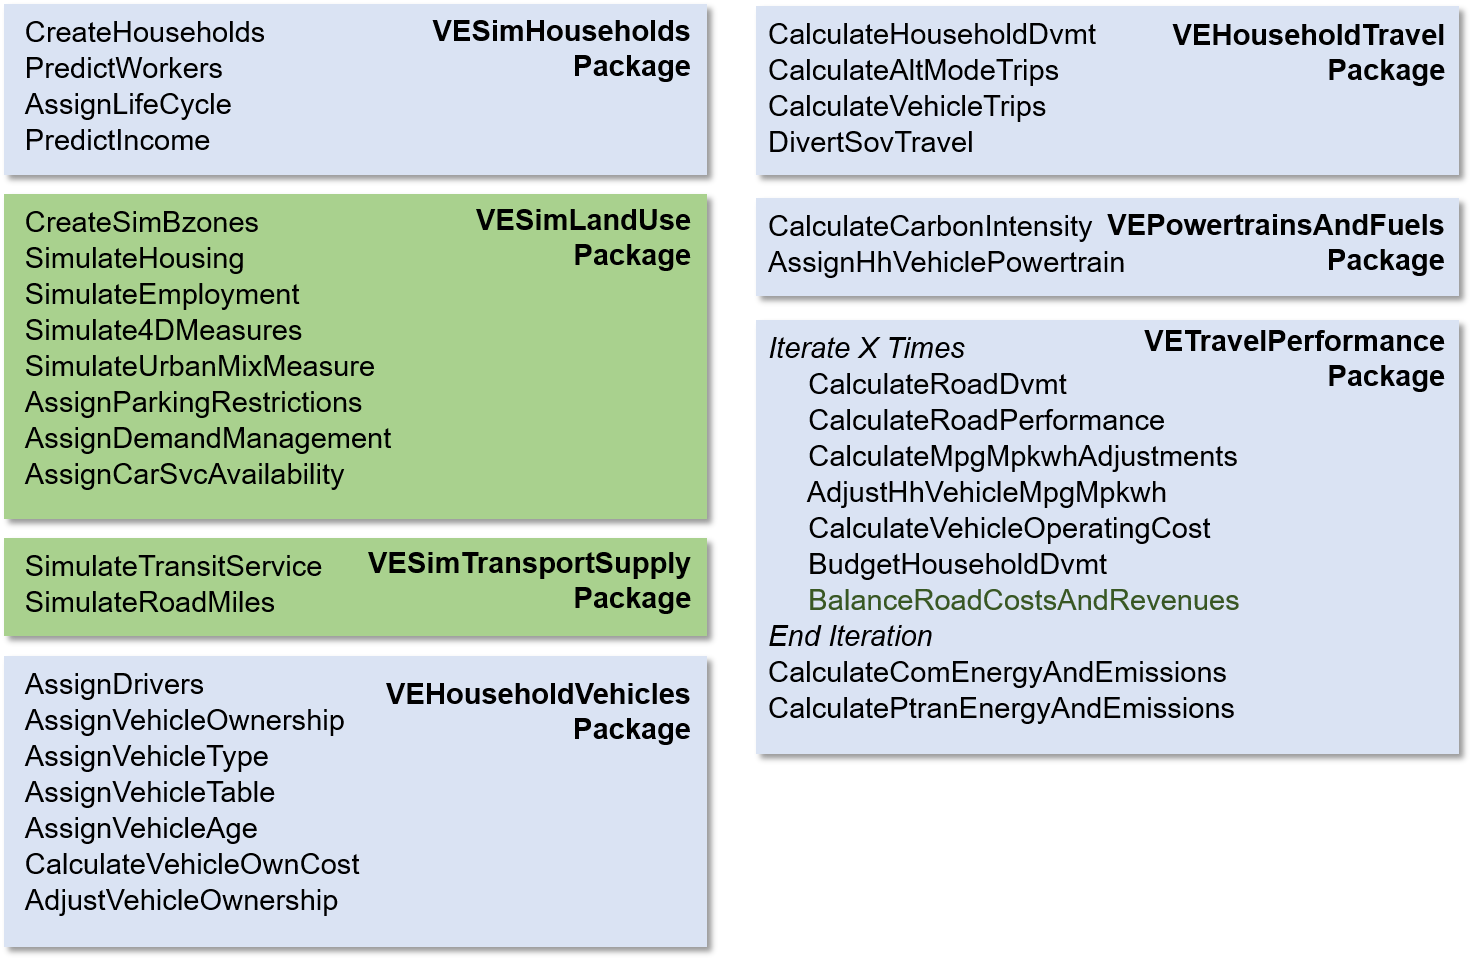
The following diagrams show how these two model differ at the early stages. VE-State uses simulation methods to generate land use and housing input in Bzone level.
11.1.2 VE-State Structure
Bzone level attributes are required by a number of modules so methods need to be developed for synthesizing a representative set of Bzones and their characteristics from policies and attributes specified at the Azone and Marea levels. Something like this is done in the GreenSTEP model where a likely distribution of neighborhood population density is synthesized from the overall metropolitan area density. Azone level inputs are provided for base year population and area by development type (metropolitan, town, rural), population growth by development type, and the ratio of urban area growth to population growth. From these inputs, average density is calculated by Azone and development type and a model is applied to synthesize a distribution of neighborhood densities from the average density.
All of the VE-RSPM modules which assign Bzone characteristics are contained in the VELandUse package. The modules that are developed to synthesize Bzones and their characteristics will be placed in a VESimLandUse package. When a VE-State model is run, the modules in the VESimLandUse package will be run instead of the modules in the VELandUse package. Otherwise the model setup is nearly the same for VE-State and VE-RSPM. The use of the VESimLandUse modules is not be limited to statewide applications however. Users could simulate Bzones in an VE-RSPM-type application that would enable metropolitan area planners to more easily define and model alternative land use scenarios as is done in VE-RPAT (Rapid Policy Analysis Tool) applications.
11.2 Required Bzone Attributes
Land use modeling in VE-RSPM is the basis for the land use modeling in VE-State. These modules were designed to produce datasets needed to run the new multi-modal travel model. The multi-modal module requires several activity density, diversity (i.e., activity mixing), and destination accessibility measures that in turn require households and employment to be located at the Bzone level to calculate those measures. In addition, a few multi-modal network and service level measures need to be calculated. Second, locating jobs at the Bzone level allows for the travel demand management (TDM) and parking pricing modules to establish more realistic relationships between policies and the households they would affect. This also allows household workers to be assigned to job sites and that information can be used to translate job site TDM and parking policies back to households. Finally, simulated households are assigned to Bzones. In VE-RSPM a number of single family and multifamily dwelling units are assigned to Bzones as inputs along with the relative income distribution of households in each Bzone. VE-RSPM models the housing choice of each household based on the overall supply of housing of each type in the Azone and the household characteristics. Then the model assigns each household to a Bzone based on the household’s housing choice and income, and on the relative supplies of housing of the type and household income distribution in the Bzone. The Bzone attributes that need to be synthesized are:
- Destination accessibility (i.e., accessibility to jobs and housing) measured consistent as it is used in the multi-modal travel model – This information is one of the 5D measured used in the VE-RSPM multi-modal travel model. Since synthetic zones won’t have physical locations, it can’t be calculated simply from households and employment by zone.
- Number of households proportional split of dwelling units between single family and multifamily – Number of households and dwelling unit split by Bzone is needed in order to assign households to Bzones.
- Number of jobs by sector (retail, service, other) is used in calculating several diversity measures used in the RSPM multi-modal travel model. The number of jobs is also used to associate household workers with workplace Bzones
- Area type and development type – Some practical system of zonal development classification is needed for organizing policy inputs. Policies such as travel demand management policies will be specified by Azone and area type and/or development type. These designations will also be used in the calculation of the design and distance to transit ‘5D’ measure categories that are used in the VE-RSPM multi-modal travel model.
11.3 Approach for Synthesizing Bzones and their Attributes
- The user provides inputs on:
- Azone proportional split of dwelling units by location type (metropolitan, town and rural)
- Azone proportional split of workers by job site location types (for example, proportions of rural residents in the Azone who work in rural locations, town locations, or the metropolitan area)
- Marea proportional split of Marea employment among Azones
Total activity – numbers of households and jobs – will determine the number of SimBzones in the Azone. SimBzones will have equal amounts of activity and unequal areas since activity density will vary among SimBzones. An appropriate average SimBzone activity value will be determined through evaluation of the EPA Smart Location Database (SLD).
Models will be applied to select a destination accessibility value for each Bzone. For metropolitan type development, the model will create a distribution of destination accessibility values that is consistent with the overall activity density in the metropolitan area. Random sampling from the distribution will be used to assign destination accessibility values to metropolitan SimBzones. Models will also be developed for town and rural types, but more investigation is needed in order to determine their form.
Activity density of each SimBzones will be determined as a function of the destination accessibility of each zone (because destination accessibility is a measure of activity density at a larger geographic scale). A model will be estimated from the SLD which creates a distribution of zone densities as a function of destination accessibility. An adjustment process, such as an iterative proportional fitting process (IPF), will be used to adjust densities and destination accessibilities so that the overall activity density of all the zones in a metropolitan area is equal to the input value
Further subdivision of the metropolitan area into area types will be done as a function of the destination accessibility and activity density of each zone. Four such area types are proposed: urban core, close in community, and suburban/town, low density/rural. The final typology and the relationship of area types to destination accessibility and activity density will be developed through examination of the SLD dataset. It is envisioned that area types will be defined as fuzzy sets rather than crisp sets. Although some SimBzones may be wholly one type, many SimBzones will have degrees of membership in several types. Using fuzzy sets is a more realistic recognition of the nature of area types and avoids aberrations resulting from threshold effects.
The total activity in each SimBzone is split into households and jobs using a model which relates zonal mixing to destination accessibility, activity density, and area type. This model will be specified and estimated based on investigations using the SLD data. It is anticipated that the model will produce distributions of activity splits from which values will be drawn. IPF or some other adjustment process will be used to adjust values so that the aggregation of the splits for all the SimBzones in an Azone is consistent with the Azone inputs. This model will also need to specify the split of land area between households and jobs.
Once the number of households is determined for each SimBzone, the split of dwelling units by housing type (single family, multifamily) as a function of activity density. The SLD and census data will be used to develop this model. IPF is be used to fit the distribution of SimBzone values to Azone level control totals. This will allow users to specify Azone ratios as policy inputs.
A variant of the VE-RSPM housing model is applied to assign households to housing types and to Bzones. One thing to be worked out is whether the allocation to SimBzones considers household income or not. In VE-RSPM, relative Bzone income distributions are input and these are used in the process of allocating households to Bzones. This enables VE-State users to model general relationships of income to parts of the metropolitan area (e.g., the effect of gentrification in the urban core).
Jobs in each SimBzone will be split into numbers of retail, service, and other jobs. The approach for doing this is yet to be determined. SimBzone splits will be constrained so that they total to Azone splits that are inputs. The model will probably be a function of the destination accessibility, employment density, and mixing of households and employment in the SimBzone. The SLD data will be used to develop and estimate this model. Thought will be given as to whether there should be control totals on the mix for a metropolitan area. If so, IPF or some other adjustment process would need to be used to match the totals.
Workers will be assigned to SimBzone job sites. How this is done is yet to be determined. It is proposed that an agile development approach be used where the first iteration of the model will be a random assignment of workers to job sites. Other extensions that could be considered if there is time/budget investigation could be done using LEHD data and SLD data to look for relationships between worker residence by area type and worker job site by area type. Relative income could also be considered.
Once numbers of households and numbers of jobs by type are assigned to SimBzones, all the remaining density and diversity measures can be calculated.
The distance to transit measure is modeled for metropolitan SimBzones as a function of the metropolitan-level transit supply measure and the SimBzone attributes for destination
Development type (e.g., residential, employment, mixed, transit-oriented development, greenfield), are assigned to SimBzones based on the density, diversity, and distance to transit measures. These development types, like the area types may be fuzzy sets. The SLD is used to create the development type specifications. The design will enable model users to input Marea goals for the proportional split of development types. The model will adjust the allocation of development types consistent with the goals but constrained to plausible levels.
Network design measures used by the VE-RSPM multi-modal travel model (e.g., multi-modal network density, pedestrian network density) will be applied based on inputs related to area and development type. The SLD will be used to identify ranges of values by area and development type. Users will specify in inputs goals relative to these ranges by Azone, development type and area type.
The parking pricing, travel demand management, and car service inputs is specified by Azone, area type, and development type. These will then be translated to the SimBzone based on the SimBzone area type and development type. After that is done, the
AssignDemandManagement,AssignParkingRestrictions, andAssignCarSvcAvailabilitymodules can run as they currently do. Thought will be given as to how to simplify inputs so that users are not required to provide inputs for every combination of Azone, area type and development type.
11.4 Modules and Outputs
The VE-State model is a compilation of several modules, listed below:
Each of these modules use different input data. Generally speaking, the VE-State inputs are classified into the five following categories:
- User input model parameters: These are input parameters (model or scenario specific), defined in model_parameters.json, that users should review and modify as needed.
- Fixed input model parameters: These are input parameters specific to the model, defined in model_parameters.json, that users should not typically modify.
- User input files: These are input files (model or scenario specific) that users should review and modify as needed.
- Fixed input files: These are input parameters specific to the model that are fixed.
- Internal module inputs: These are inputs created by other VE-RSPM modules.
The following section decribes each module, its required inputs, and its generated outputs.
11.4.1 CreateHouseholds
This module creates simulated households using inputs of population by age group by simulation year.
11.4.1.1 User Input Files
Household population (azone_hh_pop_by_age.csv)
Household size (azone_hhsize_targets.csv)
Group quarter population (azone_gq_pop_by_age.csv)
11.4.1.2 Module Outputs
Households are created with the number of persons in each of six age categories (0-14, 15-19, 20-29, 30-54, 55-64, and 65+) and the total number of persons in the household. Two types of households are created: regular households (i.e. not persons living in group quarters) and group quarters households .
- HhId: Unique household ID
- HhSize: Number of persons
- Age0to14: Persons in 0 to 14 year old age group
- Age15to19: Persons in 15 to 19 year old age group
- Age20to29: Persons in 20 to 29 year old age group
- Age30to54: Persons in 30 to 54 year old age group
- Age55to64: Persons in 55 to 64 year old age group
- Age65Plus: Persons in 65 or older age group
-
HhType: Coded household age composition (e.g.,
2-1-0-2-0-0) orGrpfor group quarters
For more information see here
11.4.2 PredictWorkers
This module assigns workers by age to households and to non-institutional group quarters population. It is a simple model which predicts workers as a function of the household type and age composition.
11.4.2.1 User Input Files
- Relative employment (azone_relative_employment.csv)
11.4.2.2 Internal Module Inputs
| Package | Module | Outputs | Description |
|---|---|---|---|
| VESimHouseholds | CreateHouseholds | Age0to14 | Persons in 0 to 14 year old age group |
| VESimHouseholds | CreateHouseholds | Age15to19 | Persons in 15 to 19 year old age group |
| VESimHouseholds | CreateHouseholds | Age20to29 | Persons in 20 to 29 year old age group |
| VESimHouseholds | CreateHouseholds | Age30to54 | Persons in 30 to 54 year old age group |
| VESimHouseholds | CreateHouseholds | Age55to64 | Persons in 55 to 64 year old age group |
| VESimHouseholds | CreateHouseholds | Age65Plus | Persons in 65 or older age group |
| VESimHouseholds | CreateHouseholds | HHType | Coded household age composition |
11.4.2.3 Module Outputs
- Wkr15to19: Workers in 15 to 19 year old age group
- Wkr20to29: Workers in 20 to 29 year old age group
- Wkr30to54: Workers in 30 to 54 year old age group
- Wkr55to64: Workers in 55 to 64 year old age group
- Wkr65Plus: Workers in 65 or older age group
- Workers: Total workers
- NumWkr: Number of workers residing in the zone
For more information see here
11.4.3 AssignLifeCycle
This module assigns a life cycle category to each household. The life cycle categories are similar, but not the same as, those established for the National Household Travel Survey (NHTS). The age categories used in VisionEval models are broader than those used by the NHTS to identify children of different ages. This is a simple model with set of rules that assigns age group categories based on the age of persons and workers in the household.
11.4.3.2 Internal Module Inputs
| Package | Module | Outputs | Description |
|---|---|---|---|
| VESimHouseholds | CreateHouseholds | Age0to14 | Persons in 0 to 14 year old age group |
| VESimHouseholds | CreateHouseholds | Age15to19 | Persons in 15 to 19 year old age group |
| VESimHouseholds | CreateHouseholds | Age20to29 | Persons in 20 to 29 year old age group |
| VESimHouseholds | CreateHouseholds | Age30to54 | Persons in 30 to 54 year old age group |
| VESimHouseholds | CreateHouseholds | Age55to64 | Persons in 55 to 64 year old age group |
| VESimHouseholds | CreateHouseholds | Age65Plus | Persons in 65 or older age group |
| VESimHouseholds | CreateHouseholds | HHType | Coded household age composition |
| VESimHouseholds | PredictWorkers | Wrk15to19 | Workers in 15 to 19 year old age group |
| VESimHouseholds | PredictWorkers | Wrk20to29 | Workers in 20 to 29 year old age group |
| VESimHouseholds | PredictWorkers | Wrk30to54 | Workers in 30 to 54 year old age group |
| VESimHouseholds | PredictWorkers | Wrk55to64 | Workers in 55 to 64 year old age group |
| VESimHouseholds | PredictWorkers | Wrk65Plus | Workers in 65 or older age group |
11.4.3.3 Module Outputs
-
LifeCycle: Household life cycle as defined by 2009 NHTS
LIF_CYCvariable
For more information see here
11.4.4 PredictIncome
This module predicts the income for each simulated household given the number of workers in each age group and the average per capita income for the Azone where the household resides.
11.4.4.1 User Input Files
- Regional income (azone_per_cap_inc.csv)
11.4.4.2 Internal Module Inputs
| Package | Module | Outputs | Description |
|---|---|---|---|
| VESimHouseholds | CreateHouseholds | HHSize | Number of persons in the household |
| VESimHouseholds | CreateHouseholds | Age65Plus | Persons in 65 or older age group |
| VESimHouseholds | CreateHouseholds | HHType | Coded household age composition |
| VESimHouseholds | PredictWorkers | Wrk15to19 | Workers in 15 to 19 year old age group |
| VESimHouseholds | PredictWorkers | Wrk20to29 | Workers in 20 to 29 year old age group |
| VESimHouseholds | PredictWorkers | Wrk30to54 | Workers in 30 to 54 year old age group |
| VESimHouseholds | PredictWorkers | Wrk55to64 | Workers in 55 to 64 year old age group |
11.4.4.3 Module Outputs
- Income: Total annual household (non-group and group quarters) income
For more information see here
11.4.5 Initialize
Modules in the VESimLandUse package synthesize Bzones and their land use attributes as a function of Azone characteristics as well as data derived from the US Environmental Protection Agency’s Smart Location Database (SLD) augmented with US Census housing and household income data, and data from the National Transit Database. Details on these data are included in the VESimLandUseData package. The combined dataset contains a number of land use attributes at the US Census block group level. The goal of Bzone synthesis to generate a set of SimBzones in each Azone that reasonably represent block group land use characteristics given the characteristics of the Azone, the Marea that the Azone is a part of, and scenario inputs provided by the user.
Many of the models and procedures used in Bzone synthesis pivot from profiles developed from these data sources for specific urbanized areas, as well as more general profiles for different urbanized area population size categories, towns, and rural areas. Using these specific and general profiles enables the simulated Bzones (SimBzones) to better represent the areas being modeled and the variety of conditions found in different states. Following is a listing of the urbanized areas for which profiles have been developed. Note that urbanized areas that cross state lines are split into the individual state components. This is done to facilitate the development of state models and to better reflect the characteristics of the urbanized area characteristics in each state.
It is incumbent on the model user to identify the name of the urbanized area profile that will be used for each of the Mareas in the model. This module reads in the names assigned in the “marea_uza_profile_names.csv” file and checks their validity. If any are invalid, input processing will stop and error messages will be written to the log identifying the problem names. The following table identifies the names that may be used.
11.4.5.1 User Input Files
Metropolitan area names (marea_uza_profile_names.csv)
Household location type proportions (azone_hh_loc_type_prop.csv)
Work location type proportions (azone_wkr_loc_type_prop.csv)
Land area by location type (azone_loc_type_land_area.csv)
Group quarter population by location type proportions (azone_gq_pop-prop_by_area-type.csv)
11.4.6 CreateSimBzones
This module synthesizes Bzones and their land use attributes as a function of Azone characteristics as well as data derived from the US Environmental Protection Agency’s Smart Location Database (SLD) augmented with US Census housing and household income data, and data from the National Transit Database. Details on these data are included in the VESimLandUseData package. The combined dataset contains a number of land use attributes at the US Census block group level. The goal of Bzone synthesis to generate a set of SimBzones in each Azone that reasonably represent block group land use characteristics given the characteristics of the Azone, the Marea that the Azone is a part of, and scenario inputs provided by the user.
Many of the models and procedures used in Bzone synthesis pivot from profiles developed from these data sources for specific urbanized areas, as well as more general profiles for different urbanized area population size categories, towns, and rural areas. Using these specific and general profiles enables the simulated Bzones (SimBzones) to better represent the areas being modeled and the variety of conditions found in different states. The documentation for the Initialize module has a listing of urbanized area profile names.
The models and procedures in this module create SimBzones within each Azone that simulate the land use characteristics of neighborhoods likely to be found in the Azone. The SimBzones are assigned quantities of households and jobs and are attributed with several land use measures in the process. The characteristics are:
- Location Type: Identification of whether the SimBzone is located in an urbanized area, a town (i.e. an urban-type area that is not large enough to be urbanized), rural (i.e. dispersed low-density development)
- Households: Number of households in each SimBzone
- Employment: Number of jobs in each SimBzone
- Activity Density: Number of households and jobs per acre
- Land Use Diversity: Measures of the degree of mixing of households and jobs
- Destination Accessibility: Measures of proximity to households and jobs
- Area Type and Development Type: Categories which describe the relative urban nature of the SimBzone (area type) and the character of development in the SimBzone (development type).
- Employment Split: Number of retail, service, and other jobs in each SimBzone.
11.4.6.2 Internal Module Inputs
| Package | Module | Outputs | Description |
|---|---|---|---|
| VESimHouseholds | PredictWorkers | NumWkr | see PredictWorkers |
| VESimLandUse | Initialize | PropMetroHh | see Initialize |
| VESimLandUse | Initialize | PropTownHh | see Initialize |
| VESimLandUse | Initialize | PropRuralHh | see Initialize |
| VESimLandUse | Initialize | PropWkrInMetroJobs | see Initialize |
| VESimLandUse | Initialize | PropWkrInTownJobs | see Initialize |
| VESimLandUse | Initialize | PropWkrInRuralJobs | see Initialize |
| VESimLandUse | Initialize | PropMetroJobs | see Initialize |
| VESimLandUse | Initialize | MetroLandArea | see Initialize |
| VESimLandUse | Initialize | TownLandArea | see Initialize |
| VESimLandUse | Initialize | RuralAveDensity | see Initialize |
11.4.6.3 Module Outputs
- LocType: Location type (Urban, Town, Rural) of the place where the household resides
- NumHh: Number of households allocated to the SimBzone
- TotEmp: Total number of jobs in zone
- RetEmp: Number of jobs in retail sector in zone
- SvcEmp: Number of jobs in service sector in zone
- OthEmp: Number of jobs in other than the retail and service sectors in zone
- AreaType: Area type (center, inner, outer, fringe) of the Bzone
- DevType: Location type (Urban, Town, Rural) of the Bzone
- D1D: Gross activity density (employment + households) on unprotected land in zone (Ref: EPA 2010 Smart Location Database)
- D5: Destination accessibility of zone calculated as harmonic mean of jobs within 2 miles and population within 5 miles
- UrbanArea: Area that is Urban and unprotected (i.e. developable) within the zone
- TownArea: Area that is Town and unprotected (i.e. developable) within the zone
- RuralArea: Area that is Rural and unprotected (i.e. developable) within the zone
- SFDU: Number of single family dwelling units (PUMS codes 01 - 03) in zone
- MFDU: Number of multi-family dwelling units (PUMS codes 04 - 09) in zone
For more information see here
11.4.7 SimulateHousing
This module assigns a housing type, either single-family (SF) or multifamily (MF) to regular households based on the respective supplies of SF and MF dwelling units in the housing market to which the household is assigned (i.e. the Azone the household is assigned to) and on household characteristics. It then assigns each household to a SimBzone based on the household’s housing type as well as the supply of housing by type and SimBzone. The module assigns non-institutional group quarters households to SimBzones randomly.
11.4.7.2 Internal Module Inputs
| Package | Module | Outputs | Description |
|---|---|---|---|
| VESimHouseholds | CreateHouseholds | HhId | Household id |
| VESimHouseholds | PredictWorkers | Workers | Total workers in the household |
| VESimLandUse | Initialize | PropGQPopCenter | see Initialize |
| VESimLandUse | Initialize | PropGQPopInner | see Initialize |
| VESimLandUse | Initialize | PropGQPopOuter | see Initialize |
| VESimLandUse | Initialize | PropGQPopFringe | see Initialize |
| VESimLandUse | CreateSimBzones | SFDU | see CreateSimBzones |
| VESimLandUse | CreateSimBzones | MFDU | see CreateSimBzones |
| VESimLandUse | CreateSimBzones | LocType | see CreateSimBzones |
| VESimLandUse | CreateSimBzones | AreaType | see CreateSimBzones |
| VESimHouseholds | CreateHouseholds | HhSize | Total workers in the household |
| VESimHouseholds | CreateHouseholds | Age15to19 | Number of workers residing in the zone |
| VESimHouseholds | CreateHouseholds | Age20to29 | Household id |
| VESimHouseholds | CreateHouseholds | Age30to54 | Total workers in the household |
| VESimHouseholds | CreateHouseholds | Age55to64 | Number of workers residing in the zone |
| VESimHouseholds | CreateHouseholds | Age65Plus | Total workers in the household |
| VESimHouseholds | CreateHouseholds | HhType | Number of workers residing in the zone |
11.4.7.3 Module Outputs
- HouseType: Type of dwelling unit in which the household resides (SF = single family, MF = multi-family, GQ = group quarters
- LocType: Location type (Urban, Town, Rural) of the place where the household resides
- Pop: Total population residing in Bzone
- UrbanPop: Urbanized area population in the Marea
- TownPop: Town (i.e. urban but non-urbanized area) in the Marea
- RuralPop: Rural (i.e. not urbanized and not town) population in the Marea
- NumWkr: Number of jobs in retail sector in zone
- UrbanIncome: Total household income of the urbanized area population in the Marea
- TownIncome: Total household income of the town (i.e. urban but non-urbanized area) population in the Marea
- RuralIncome: Total household income of the rural (i.e. not urbanized and not town) population in the Marea
For more information see here
11.4.8 SimulateEmployment
This module assign workers SimBzone work locations. A worker table is created which identifies a unique worker ID, the household ID the worker is a part of, and the SimBzone, Azone, and Marea of the worker job location.
11.4.8.2 Internal Module Inputs
| Package | Module | Outputs | Description |
|---|---|---|---|
| VESimHouseholds | CreateHouseholds | HhId | Household id |
| VESimHouseholds | PredictWorkers | Workers | Total workers in the household |
| VESimLandUse | CreateSimBzones | TotEmp | see CreateSimBzones |
| VESimLandUse | CreateSimBzones | LocType | see CreateSimBzones |
11.4.8.3 Module Outputs
- WkrId: Unique worker ID
- Bzone: Bzone ID of worker job location
- Azone: Azone ID of worker job location
- Marea: Marea ID of worker job location
For more information see here
11.4.9 Simulate4DMeasures
This module calculates several 4D measures by SimBzone including density, diversity (i.e. mixing of land uses), and pedestrian-orientedn transportation network design. These measures are the same as or are similar to measures included in the Environmental Protection Agency’s (EPA)
11.4.9.1 User Input Files
- D3bpo4 value or different location types (marea_d3bpo4_adj.csv)
11.4.9.2 Internal Module Inputs
| Package | Module | Outputs | Description |
|---|---|---|---|
| VESimLandUse | CreateSimBzones | TotEmp | see CreateSimBzones |
| VESimLandUse | CreateSimBzones | RetEmp | see CreateSimBzones |
| VESimLandUse | CreateSimBzones | SvcEmp | see CreateSimBzones |
| VESimLandUse | SimulateHousing | Pop | see SimulateHousing |
| VESimLandUse | CreateSimBzones | NumHh | see CreateSimBzones |
| VESimLandUse | SimulateHousing | NumWkr | see SimulateHousing |
| VESimLandUse | CreateSimBzones | UrbanArea | see CreateSimBzones |
| VESimLandUse | CreateSimBzones | TownArea | see CreateSimBzones |
| VESimLandUse | CreateSimBzones | RuralArea | see CreateSimBzones |
| VESimLandUse | CreateSimBzones | AreaType | see CreateSimBzones |
| VESimLandUse | CreateSimBzones | DevType | see CreateSimBzones |
| VESimLandUse | CreateSimBzones | LocType | see CreateSimBzones |
11.4.9.3 Module Outputs
- D1B: Gross population density (people/acre) on unprotected
- D1C: Gross employment density (jobs/acre) on unprotected land
- D2A_JPHH: Ratio of jobs to households in zone
- D2A_WRKEMP: Ratio of workers to jobs in zone
-
D2A_EPHHM: Employment and household entropy measure for zone considering numbers of households, retail jobs, service jobs, and other jobs
- D3bpo4: Intersection density in terms of pedestrian-oriented intersections having four or more legs per square mile
For more information see here
11.4.10 SimulateUrbanMixMeasure
This module simulates an urban mixed-use measure based on the 2001 National Household Travel Survey measure of the tract level urban/rural indicator
11.4.10.1 User Input Files
- Target for proportion of households in mixed-use neighborhoods (marea_mix_targets.csv)
11.4.10.2 Internal Module Inputs
| Package | Module | Outputs | Description |
|---|---|---|---|
| VESimLandUse | SimulateHousing | Pop | see SimulateHousing |
| VESimLandUse | SimulateHousing | UrbanPop | see SimulateHousing |
| VESimLandUse | SimulateHousing | TownPop | see SimulateHousing |
| VESimLandUse | SimulateHousing | RuralPop | see SimulateHousing |
| VESimLandUse | CreateSimBzones | NumHh | see CreateSimBzones |
| VESimLandUse | CreateSimBzones | UrbanArea | see CreateSimBzones |
| VESimLandUse | CreateSimBzones | TownArea | see CreateSimBzones |
| VESimLandUse | CreateSimBzones | RuralArea | see CreateSimBzones |
| VESimLandUse | CreateSimBzones | SFDU | see CreateSimBzones |
| VESimLandUse | CreateSimBzones | MFDU | see CreateSimBzones |
11.4.10.3 Module Outputs
- IsUrbanMixNbrhd: Flag identifying whether household is (1) or is not (0) in urban mixed-use neighborhood
For more information see here
11.4.11 AssignParkingRestrictions
This module identifies parking restrictions and prices affecting households at their residences, workplaces, and other places they are likely to visit in the urban area. The module takes user inputs on parking restrictions and prices by Bzone and calculates for each household the number of free parking spaces available at the household’s residence, which workers pay for parking and whether their payment is part of a cash-out-buy-back program, the cost of residential parking for household vehicles that can’t be parked in a free space, the cost for workplace parking, and the cost of parking for other activities such as shopping. The parking restriction/cost information is used by other modules in calculating the cost of vehicle ownership and the cost of vehicle use.
11.4.11.1 User Input Files
Parking availability (marea_parking-avail_by_area-type.csv)
Parking cost (marea_parking-cost_by_area-type.csv)
11.4.11.2 Internal Module Inputs
| Package | Module | Outputs | Description |
|---|---|---|---|
| VESimLandUse | CreateSimBzones | RetEmp | see CreateSimBzones |
| VESimLandUse | CreateSimBzones | SvcEmp | see CreateSimBzones |
| VESimLandUse | CreateSimBzones | NumHh | see CreateSimBzones |
| VESimLandUse | CreateSimBzones | UrbanArea | see CreateSimBzones |
| VESimLandUse | CreateSimBzones | AreaType | see CreateSimBzones |
| VESimLandUse | CreateSimBzones | LocType | see CreateSimBzones |
| VESimLandUse | SimulateHousing | HouseType | see SimulateHousing |
11.4.11.3 Module Outputs
- FreeParkingSpaces: Number of free parking spaces available to the household
- ParkingUnitCost: Daily cost for long-term parking (e.g. paid on monthly basis)
- OtherParkingCost: Daily cost for parking at shopping locations or other locations of paid parking not including work (not adjusted for number of vehicle trips)
- PaysForParking: Does worker pay for parking: 1 = yes, 0 = no
- IsCashOut: Is worker paid parking in cash-out-buy-back program: 1 = yes, 0 = no
- ParkingCost: Daily cost for long-term parking (e.g. paid on monthly basis)
For more information see here
11.4.12 AssignDemandManagement
This module assigns demand management program participation to households and to workers. Households are assigned to individualized marketing program participation. Workers are assigned to employee commute options participation. The module computes the net proportional reduction in household DVMT based on the participation in travel demand management programs.
11.4.12.1 User Input Files
- Travel demand management (marea_travel-demand-mgt_by_area-type.csv)
11.4.12.2 Internal Module Inputs
| Package | Module | Outputs | Description |
|---|---|---|---|
| VESimHouseholds | CreateHouseholds | HhSize | see CreateHouseholds |
| VESimHouseholds | PredictWorkers | workers | see PredictWorkers |
11.4.12.3 Module Outputs
- IsIMP: dentifies whether household is participant in travel demand management individualized marketing program (IMP): 1 = yes, 0 = n
- PropTdmDvmtReduction: Proportional reduction in household DVMT due to participation in travel demand management programs
- IsECO: Identifies whether worker is a participant in travel demand management employee commute options program: 1 = yes, 0 = no
For more information see here
11.4.13 AssignCarSvcAvailability
This module assigns car service availability levels (Low, High) to Bzones and households. Car services include taxis, car sharing services (e.g. Car-To-Go, Zipcar), and future automated taxi services
11.4.13.1 User Input Files
- Car service availability (marea_carsvc_availability)
11.4.13.2 Internal Module Inputs
| Package | Module | Outputs | Description |
|---|---|---|---|
| VESimLandUse | CreateSimBzones | NumHh | see CreateSimBzones |
| VESimLandUse | CreateSimBzones | AreaType | see CreateSimBzones |
| VESimLandUse | CreateSimBzones | TotEmp | see CreateSimBzones |
| VESimLandUse | Calculate4DMeasures | D1D | see Calculate4DMeasures |
11.4.13.3 Module Outputs
- IsIMP: dentifies whether household is participant in travel demand management individualized marketing program (IMP): 1 = yes, 0 = n
- PropTdmDvmtReduction: Proportional reduction in household DVMT due to participation in travel demand management programs
- IsECO: Identifies whether worker is a participant in travel demand management employee commute options program: 1 = yes, 0 = no
For more information see here
11.4.14 SimulateTransitService
This module assigns transit service level to the urbanized portion of each Marea and to neighborhoods (SimBzones) within the urbanized area. Annual revenue-miles (i.e. transit miles in revenue service) by transit mode type are read from an input file
11.4.14.1 User Input Files
- Transit service for Marea (marea_transit_service.csv)
11.4.14.2 Internal Module Inputs
| Package | Module | Outputs | Description |
|---|---|---|---|
| VESimLandUse | CreateSimBzones | NumHh | see CreateSimBzones |
| VESimLandUse | CreateSimBzones | AreaType | see CreateSimBzones |
| VESimLandUse | CreateSimBzones | TotEmp | see CreateSimBzones |
| VESimLandUse | CreateSimBzones | UrbanArea | see CreateSimBzones |
| VESimLandUse | CreateSimBzones | DevType | see CreateSimBzones |
| VESimLandUse | SimulateHousing | UrbanPop | see SimulateHousing |
11.4.14.3 Module Outputs
- TranRevMiPC: Ratio of annual bus-equivalent revenue-miles (i.e. revenue-miles at the same productivity - passenger miles per revenue mile - as standard bus) to urbanized area population
- VanDvmt: Total daily miles traveled by vans of various sizes to provide demand responsive, vanpool, and similar services.
- BusDvmt: Total daily miles traveled by buses of various sizes to provide bus service of various types.
- RailDvmt: Total daily miles traveled by light rail, heavy rail, commuter rail, and similar types of vehicles.
- D4c: Aggregate frequency of transit service within 0.25 miles of block group boundary per hour during evening peak period (Ref: EPA 2010 Smart Location Database)
For more information see here
11.4.15 SimulateRoadMiles
This module assigns freeway and arterial lane-miles to metropolitan areas (Marea) and calculates freeway lane-miles per capita.
11.4.15.1 User Input Files
- Lane-miles for metropolitan areas (marea_lane_miles.csv)
11.4.15.2 Internal Module Inputs
| Package | Module | Outputs | Description |
|---|---|---|---|
| VESimLandUse | SimulateHousing | UrbanPop | see SimulateHousing |
For more information see here
11.4.16 AssignDrivers
This module assigns drivers by age group to each household as a function of the numbers of persons and workers by age group, the household income, land use characteristics, and public transit availability.
11.4.16.1 User Input Files
- Adjustment proportion for household drivers by age group for the region (region_hh_driver_adjust_prop.csv)
11.4.16.2 Internal Module Inputs
| Package | Module | Outputs | Description |
|---|---|---|---|
| VETransportSupply | AssignTransitService | TranRevMiPC | Ratio of annual bus-equivalent revenue-miles (i.e. revenue-miles at the same productivity - passenger miles per revenue mile - as standard bus) to urbanized area population |
| VELandUse | Calculate4DMeasures | D1B | Gross population density (people/acre) on unprotected (i.e. developable) land in zone |
| VESimHouseholds | CreateHouseholds | HhId | Household id |
| VESimHouseholds | CreateHouseholds | Age15to19 | Persons in 15 to 19 year old age group |
| VESimHouseholds | CreateHouseholds | Age20to29 | Persons in 20 to 29 year old age group |
| VESimHouseholds | CreateHouseholds | Age30to54 | Persons in 30 to 54 year old age group |
| VESimHouseholds | CreateHouseholds | Age55to64 | Persons in 55 to 64 year old age group |
| VESimHouseholds | CreateHouseholds | Age65Plus | Persons in 65 or older age group |
| VESimHouseholds | PredictIncome | Income | Total annual income of household |
| VESimHouseholds | CreateHouseholds | HHSize | Number of persons in the household |
| VELandUse | CalculateUrbanMixMeasure | IsUrbanMixNbrhd | Flag identifying whether household is (1) or is not (0) in urban mixed-use neighborhood |
| VELandUse | AssignLocTypes | LocType | Location type (Urban, Town, Rural) of the place where the household resides |
11.4.16.3 Module Outputs
- Drv15to19: Number of drivers 15 to 19 years old
- Drv20to29: Number of drivers 20 to 29 years old
- Drv30to54: Number of drivers 30 to 54 years old
- Drv55to64: Number of drivers 55 to 64 years old
- Drv65Plus: Number of drivers 65 or older
- Drivers: Number of drivers in household
- DrvAgePersons: Number of people 15 year old or older in the household
For more information see here
11.4.17 AssignVehicleOwnership
This module determines the number of vehicles owned or leased by each household as a function of household characteristics, land use characteristics, and transportation system characteristics.
11.4.17.2 Internal Module Inputs
| Package | Module | Outputs | Description |
|---|---|---|---|
| VETransportSupply | AssignTransitService | TranRevMiPC | Ratio of annual bus-equivalent revenue-miles to urbanized area population |
| VELandUse | Calculate4DMeasures | D1B | Gross population density (people/acre) on unprotected (i.e. developable) land in zone |
| VESimHouseholds | PredictWorkers | Workers | Total workers in the household |
| VEHouseholdVehicles | AssignDrivers | Drivers | Number of drivers in household |
| VESimHouseholds | CreateHouseholds | Age65Plus | Persons in 65 or older age group |
| VELandUse | PredictHousing | HouseType | Type of dwelling unit of the household |
| VESimHouseholds | PredictIncome | Income | Total annual income of household |
| VESimHouseholds | CreateHouseholds | HHSize | Number of persons in the household |
| VELandUse | CalculateUrbanMixMeasure | IsUrbanMixNbrhd | Flag identifying whether household is (1) or is not (0) in urban mixed-use neighborhood |
| VELandUse | AssignLocTypes | LocType | Location type (Urban, Town, Rural) of the place where the household resides |
11.4.17.3 Module Outputs
- Vehicles: Number of automobiles and light trucks owned or leased by the household including high level car service vehicles available to driving-age persons
For more information see here
11.4.18 AssignVehicleType
This module identifies how many household vehicles are light trucks and how many are automobiles. Light trucks include pickup trucks, sport utility vehicles, vans, and any other vehicle not classified as a passenger car. Automobiles are vehicles classified as passenger cars.
11.4.18.1 User Input Files
- Light truck proportion for household vehicles by Azone (azone_lttrk_prop.csv)
11.4.18.2 Internal Module Inputs
| Package | Module | Outputs | Description |
|---|---|---|---|
| VELandUse | Calculate4DMeasures | D1B | Gross population density (people/acre) on unprotected (i.e. developable) land in zone |
| VESimHouseholds | CreateHouseholds | HhId | Household id |
| VESimHouseholds | CreateHouseholds | Age0to14 | Persons in 0 to 14 year old age group |
| VESimHouseholds | CreateHouseholds | Age15to19 | Persons in 15 to 19 year old age group |
| VEHouseholdVehicles | AssignDrivers | Drivers | Number of drivers in household |
| VEHouseholdVehicles | AssignVehicleOwnership | Vehicles | Number of automobiles and light trucks owned or leased by the household including high level car service vehicles available to driving-age persons |
| VELandUse | PredictHousing | HouseType | Type of dwelling unit of the household |
| VESimHouseholds | PredictIncome | Income | Total annual income of household |
| VESimHouseholds | CreateHouseholds | HHSize | Number of persons in the household |
| VELandUse | CalculateUrbanMixMeasure | IsUrbanMixNbrhd | Flag identifying whether household is (1) or is not (0) in urban mixed-use neighborhood |
11.4.18.3 Module Outputs
- NumLtTrk: Number of light trucks (pickup, sport-utility vehicle, and van) owned or leased by household
- NumAuto: Number of automobiles (i.e., four-tire passenger vehicles that are not light trucks) owned or leased by household
For more information see here
11.4.19 CreateVehicleTable
This module creates a vehicle table and populates it with household ID and geography fields.
11.4.19.1 User Input Files
- Car service characteristics by Azone (azone_carsvc_characteristics.csv)
11.4.19.2 Internal Module Inputs
| Package | Module | Outputs | Description |
|---|---|---|---|
| VEHouseholdVehicles | AssignVehicleOwnership | Vehicles | Number of automobiles and light trucks owned or leased by the household including high level car service vehicles available to driving-age persons |
| VEHouseholdVehicles | AssignDrivers | DrvAgePersons | Number of people 15 year old or older in the household |
| VELandUse | AssignCarSvcAvailability | CarSvcLevel | Level of car service availability for household. High means access is competitive with household owned car. Low is not competitive. |
11.4.19.3 Module Outputs
- VehId: Unique vehicle ID
-
VehicleAccess: Identifier whether vehicle is owned by household (
Own), if vehicle is low level car service (LowCarSvc), or if vehicle is high level car service (HighCarSvc)
For more information see here
11.4.20 AssignVehicleAge
This module assigns vehicle ages to each household vehicle. Vehicle age is assigned as a function of the vehicle type (auto or light truck), household income, and assumed mean vehicle age by vehicle type and Azone. Car service vehicles are assigned an age based on input assumptions with no distinction between vehicle type.
11.4.20.1 User Input Files
Vehicles mean age for household vehicles by Azone (azone_hh_veh_mean_age.csv)
Car service characteristics by Azone (azone_carsvc_characteristics.csv)
11.4.20.2 Internal Module Inputs
| Package | Module | Outputs | Description |
|---|---|---|---|
| VESimHouseholds | CreateHouseholds | HhId | Household id |
| VEHouseholdVehicles | CreateVehicleTable | VehId | Unique vehicle ID |
| VESimHouseholds | PredictIncome | Income | Total annual income of household |
| VEHouseholdVehicles | AssignVehicleOwnership | Vehicles | Number of automobiles and light trucks owned or leased by the household including high level car service vehicles available to driving-age persons |
| VEHouseholdVehicles | AssignVehicleType | NumLtTrk | Number of light trucks (pickup, sport-utility vehicle, and van) owned or leased by household |
| VEHouseholdVehicles | AssignVehicleType | NumAuto | Number of automobiles (i.e. 4-tire passenger vehicles that are not light trucks) owned or leased by household |
| VEHouseholdVehicles | CreateVehicleTable | VehicleAccess | Identifier whether vehicle is owned by household (Own), if vehicle is low level car service (LowCarSvc), or if vehicle is high level car service (HighCarSvc) |
11.4.20.3 Module Outputs
- Type: Vehicle body type: Auto = automobile, LtTrk = light trucks (i.e. pickup, SUV, Van)
- Age: Vehicle age in years
For more information see here
11.4.21 CalculateVehicleOwnCost
This module calculates average vehicle ownership cost for each vehicle based on the vehicle type and age using data from the American Automobile Association (AAA). To this are added the cost of parking at the vehicle residence if free parking is not available for all household vehicles. The ownership cost is converted into an average ownership cost per mile by predicting the household DVMT, given the number of owned vehicles and splitting the miles equally among each vehicle. #### User Input Files
Vehicle ownership taxes for households (azone_hh_veh_own_taxes.csv)
Proportion of pay-as-you-drive (PAYD) insurance users (azone_payd_insurance_prop.csv)
11.4.21.1 Internal Module Inputs
| Package | Module | Outputs | Description |
|---|---|---|---|
| VESimHouseholds | CreateHouseholds | HhId | Household id |
| VEHouseholdVehicles | CreateVehicleTable | VehId | Unique vehicle ID |
| VEHouseholdVehicles | CreateVehicleTable | VehicleAccess | Identifier whether vehicle is owned by household (Own), if vehicle is low level car service (LowCarSvc), or if vehicle is high level car service (HighCarSvc) |
| VEHouseholdVehicles | AssignVehicleAge | Type | Vehicle body type: Auto = automobile, LtTrk = light trucks (i.e. pickup, SUV, Van) |
| VEHouseholdVehicles | AssignVehicleAge | Age | Vehicle age in years |
| VELandUse | AssignParkingRestrictions | FreeParkingSpaces | Number of free parking spaces available to the household |
| VELandUse | AssignParkingRestrictions | ParkingUnitCost | Daily cost for long-term parking (e.g. paid on monthly basis) |
| VEHouseholdVehicles | AssignDrivers | Drivers | Number of drivers in household |
| VEHouseholdVehicles | AssignDrivers | Drv15to19 | Number of drivers 15 to 19 years old |
| VEHouseholdVehicles | AssignDrivers | Drv20to29 | Number of drivers 20 to 29 years old |
| VEHouseholdVehicles | AssignDrivers | Drv30to54 | Number of drivers 30 to 54 years old |
| VEHouseholdVehicles | AssignDrivers | Drv55to64 | Number of drivers 55 to 64 years old |
| VEHouseholdVehicles | AssignDrivers | Drv65Plus | Number of drivers 65 and older |
| VESimHouseholds | PredictIncome | Income | Total annual income of household |
| VELandUse | AssignLocTypes | LocType | Location type (Urban, Town, Rural) of the place where the household resides |
| VEHouseholdVehicles | AssignVehicleType | NumLtTrk | Number of light trucks (pickup, sport-utility vehicle, and van) owned or leased by household |
| VEHouseholdVehicles | AssignVehicleType | NumAuto | Number of automobiles (i.e. 4-tire passenger vehicles that are not light trucks) owned or leased by household |
11.4.21.2 Module Outputs
- OwnCost: Annual cost of vehicle ownership including depreciation, financing, insurance, taxes, and residential parking in dollars
- OwnCostPerMile: Annual cost of vehicle ownership per mile of vehicle travel (dollars per mile)
- InsCost: Annual vehicle insurance cost in dollars
- HasPaydIns: Identifies whether household has pay-as-you-drive insurance for vehicles: 1 = Yes, 0 = no
For more information see here
11.4.22 AdjustVehicleOwnership
This module adjusts household vehicle ownership based on a comparison of the cost of owning a vehicle per mile of travel compared to the cost per mile of using a car service in locations where the level of car service quality is high. The determination of whether car services are substituted for ownership also depends on input assumptions regarding the average likelihood that an owner would substitute car services for a household vehicle.
11.4.22.1 User Input Files
- Car service characteristics by Azone (azone_carsvc_characteristics.csv)
11.4.22.2 Internal Module Inputs
| Package | Module | Outputs | Description |
|---|---|---|---|
| VESimHouseholds | CreateHouseholds | HhId | Household id |
| VEHouseholdVehicles | CreateVehicleTable | VehId | Unique vehicle ID |
| VEHouseholdVehicles | AssignVehicleOwnership | Vehicles | Number of automobiles and light trucks owned or leased by the household including high level car service vehicles available to driving-age persons |
| VEHouseholdVehicles | CreateVehicleTable | VehicleAccess | Identifier whether vehicle is owned by household (Own), if vehicle is low level car service (LowCarSvc), or if vehicle is high level car service (HighCarSvc) |
| VEHouseholdVehicles | AssignVehicleType | NumLtTrk | Number of light trucks (pickup, sport-utility vehicle, and van) owned or leased by household |
| VEHouseholdVehicles | AssignVehicleType | NumAuto | Number of automobiles (i.e. 4-tire passenger vehicles that are not light trucks) owned or leased by household |
| VELandUse | AssignCarSvcAvailability | CarSvcLevel | Level of car service availability for household. High means access is competitive with household owned car. Low is not competitive. |
| VEHouseholdVehicles | AssignVehicleAge | Type | Vehicle body type: Auto = automobile, LtTrk = light trucks (i.e. pickup, SUV, Van) |
| VEHouseholdVehicles | AssignVehicleAge | Age | Vehicle age in years |
| ouseholdVehicles | CalculateVehicleOwnCost | OwnCost | Annual cost of vehicle ownership including depreciation, financing, insurance, taxes, and residential parking in dollars |
| VEHouseholdVehicles | CalculateVehicleOwnCost | OwnCostPerMile | Annual cost of vehicle ownership per mile of vehicle travel (dollars per mile) |
| VEHouseholdVehicles | CalculateVehicleOwnCost | InsCost | Annual vehicle insurance cost in dollars |
11.4.22.3 Module Outputs
-
VehicleAccess: Identifier whether vehicle is owned by household (Own), if vehicle is low level car service (
LowCarSvc), or if vehicle is high level car service (HighCarSvc) - OwnCost: Annual cost of vehicle ownership per mile of vehicle travel (dollars per mile)
- OwnCostPerMile:Annual cost of vehicle ownership per mile of vehicle travel (dollars per mile)
- InsCost: Annual vehicle insurance cost in dollars
- SwitchToCarSvc: Identifies whether a vehicle was switched from owned to car service
- OwnCostSavings: Annual vehicle ownership cost (depreciation, finance, insurance, taxes) savings in dollars resulting from substituting the use of car services for a household vehicle
- OwnCost:Annual household vehicle ownership cost (depreciation, finance, insurance, taxes) savings in dollars
- Vehicles:Number of automobiles and light trucks owned or leased by the household including high level car service vehicles available to driving-age persons
- NumLtTrk:Number of light trucks (pickup, sport-utility vehicle, and van) owned or leased by household
- NumAuto:Number of automobiles (i.e. 4-tire passenger vehicles that are not light trucks) owned or leased by household
- NumHighCarSvc:Number of high level service car service vehicles available to the household (difference between number of vehicles owned by the household and number of driving age persons for households having availability of high level car services
For more information see here
11.4.23 CalculateHouseholdDvmt
This module models household average daily vehicle miles traveled as a function of household characteristics, vehicle ownership, and attributes of the neighborhood and metropolitan area where the household resides.
11.4.23.2 Internal Module Inputs
| Package | Module | Outputs | Description |
|---|---|---|---|
| VETransportSupply | AssignTransitService | TranRevMiPC | Ratio of annual bus-equivalent revenue-miles (i.e. revenue-miles at the same productivity - passenger miles per revenue mile - as standard bus) to urbanized area population |
| VETransportSupply | AssignRoadMiles | FwyLaneMiPC | Ratio of urbanized area freeway and expressway lane-miles to urbanized area population |
| VELandUse | Calculate4DMeasures | D1B | Gross population density (people/acre) on unprotected (i.e., developable) land in zone |
| VESimHouseholds | CreateHouseholds | Age0to14 | Persons in 0 to 14 year old age group |
| VEHouseholdVehicles | AssignDrivers | Drivers | Number of drivers in household |
| VESimHouseholds | PredictWorkers | Workers | Total workers in the household |
| VESimHouseholds | CreateHouseholds | HHSize | Number of persons in the household |
| VELandUse | AssignLocTypes | LocType | Location type (Urban, Town, Rural) of the place where the household resides |
| VEHouseholdVehicles | AssignVehicleOwnership | Vehicles | Number of automobiles and light trucks owned or leased by the household including high level car service vehicles available to driving-age persons |
| VESimHouseholds | PredictIncome | Income | Total annual income of household |
| VELandUse | CalculateUrbanMixMeasure | IsUrbanMixNbrhd | Flag identifying whether household is (1) or is not (0) in urban mixed-use neighborhood |
11.4.23.3 Module Outputs
- Dvmt: Average daily vehicle miles traveled by the household in autos or light trucks
-
UrbanHhDvmt: Average daily vehicle miles traveled in autos or light trucks by households residing in the urbanized portion of the
Marea -
TownHhDvmt: Average daily vehicle miles traveled in autos or light trucks by households residing in town (urban but not urbanized) portion of the
Marea -
RuralHhDvmt: Average daily vehicle miles traveled in autos or light trucks by households residing in the rural (non-urban) portion of the
Marea
For more information see here
11.4.24 CalculateAltModeTrips
This module calculates household transit trips, walk trips, and bike trips. The models are sensitive to household DVMT so they are run after all household DVMT adjustments (e.g. to account for cost on household DVMT) are made.
11.4.24.2 Internal Module Inputs
| Package | Module | Outputs | Description |
|---|---|---|---|
| VETransportSupply | AssignTransitService | TranRevMiPC | Ratio of annual bus-equivalent revenue-miles (i.e. revenue-miles at the same productivity - passenger miles per revenue mile - as standard bus) to urbanized area population |
| VELandUse | Calculate4DMeasures | D1B | Gross population density (people/acre) on unprotected (i.e. developable) land in zone |
| VESimHouseholds | CreateHouseholds | Age15to19 | Persons in 15 to 19 year old age group |
| VESimHouseholds | CreateHouseholds | Age20to29 | Persons in 20 to 29 year old age group |
| VESimHouseholds | CreateHouseholds | Age30to54 | Persons in 30 to 54 year old age group |
| VESimHouseholds | CreateHouseholds | Age55to64 | Persons in 55 to 64 year old age group |
| VESimHouseholds | CreateHouseholds | Age65Plus | Persons in 65 or older age group |
| VESimHouseholds | CreateHouseholds | Age0to14 | Persons in 0 to 14 year old age group |
| VESimHouseholds | CreateHouseholds | HHSize | Number of persons in the household |
| VELandUse | AssignLocTypes | LocType | Location type (Urban, Town, Rural) of the place where the household resides |
| VEHouseholdVehicles | AssignVehicleOwnership | Vehicles | Number of automobiles and light trucks owned or leased by the household including high level car service vehicles available to driving-age persons |
| VESimHouseholds | PredictIncome | Income | Total annual income of household |
| VELandUse | CalculateUrbanMixMeasure | IsUrbanMixNbrhd | Flag identifying whether household is (1) or is not (0) in urban mixed-use neighborhood |
| VEHouseholdTravel | CalculateHouseholdDvmt | Dvmt | Average daily vehicle miles traveled by the household in autos or light trucks |
11.4.24.3 Module Outputs
- WalkTrips: Average number of walk trips per year by household members
- BikeTrips: Average number of bicycle trips per year by household members
- TransitTrips:Average number of public transit trips per year by household members
For more information see here
11.4.25 CalculateVehicleTrips
This module calculates average daily vehicle trips for households consistent with the household DVMT. An average trip length model is applied to estimate average length of household trips reflecting the characteristics of the household and the place where they live. The average trip length is divided into the average household DVMT to get an estimate of average number of daily vehicle trips.
11.4.25.2 Internal Module Inputs
| Package | Module | Outputs | Description |
|---|---|---|---|
| VETransportSupply | AssignRoadMiles | FwyLaneMiPC | Ratio of urbanized area freeway and expressway lane-miles to urbanized area population |
| VELandUse | Calculate4DMeasures | D1B | Gross population density (people/acre) on unprotected (i.e. developable) land in zone |
| VESimHouseholds | CreateHouseholds | HHSize | Number of persons in the household |
| VELandUse | AssignLocTypes | LocType | Location type (Urban, Town, Rural) of the place where the household resides |
| VEHouseholdVehicles | AssignVehicleOwnership | Vehicles | Number of automobiles and light trucks owned or leased by the household including high level car service vehicles available to driving-age persons |
| VEHouseholdVehicles | AssignDrivers | Drivers | Number of drivers in household |
| VESimHouseholds | PredictIncome | Income | Total annual income of household |
| VELandUse | CalculateUrbanMixMeasure | IsUrbanMixNbrhd | Flag identifying whether household is (1) or is not (0) in urban mixed-use neighborhood |
| VEHouseholdTravel | CalculateHouseholdDvmt | Dvmt | Average daily vehicle miles traveled by the household in autos or light trucks |
11.4.25.3 Module Outputs
- VehicleTrips: Average number of vehicle trips per day by household members
- AveVehTripLen: Average household vehicle trip length in miles
For more information see here
11.4.26 DivertSovTravel
This module reduces household single-occupant vehicle (SOV) travel to achieve goals that are inputs to the model. The purpose of this module is to enable users to do ‘what if’ analysis of the potential of light-weight vehicles (e.g. bicycles, electric bikes, electric scooters) and infrastructure to support their use to reduce SOV travel.
11.4.26.1 User Input Files
- Proportion of diverted SOV trips (azone_prop_sov_dvmt_diverted.csv)
11.4.26.2 Internal Module Inputs
| Package | Module | Outputs | Description |
|---|---|---|---|
| VETransportSupply | AssignRoadMiles | FwyLaneMiPC | Ratio of urbanized area freeway and expressway lane-miles to urbanized area population |
| VELandUse | Calculate4DMeasures | D1B | Gross population density (people/acre) on unprotected (i.e. developable) land in zone |
| VESimHouseholds | CreateHouseholds | HHSize | Number of persons in the household |
| VELandUse | AssignLocTypes | LocType | Location type (Urban, Town, Rural) of the place where the household resides |
| VEHouseholdVehicles | AssignVehicleOwnership | Vehicles | Number of automobiles and light trucks owned or leased by the household including high level car service vehicles available to driving-age persons |
| VEHouseholdVehicles | AssignDrivers | Drivers | Number of drivers in household |
| VESimHouseholds | PredictIncome | Income | Total annual income of household |
| VELandUse | CalculateUrbanMixMeasure | IsUrbanMixNbrhd | Flag identifying whether household is (1) or is not (0) in urban mixed-use neighborhood |
| VEHouseholdTravel | CalculateHouseholdDvmt | Dvmt | Average daily vehicle miles traveled by the household in autos or light trucks |
| VESimHouseholds | CreateHouseholds | Age0to14 | Persons in 0 to 14 year old age group |
| VESimHouseholds | CreateHouseholds | Age15to19 | Persons in 15 to 19 year old age group |
| VELandUse | PredictHousing | HouseType | Type of dwelling unit of the household |
11.4.26.3 Module Outputs
- PropDvmtDiverted: Proportion of household DVMT diverted to bicycling, electric bikes, or other ‘low-speed’ travel modes
- AveTrpLenDiverted: Average length in miles of vehicle trips diverted to bicycling, electric bikes, or other ‘low-speed’ travel modes
For more information see here
11.4.27 Initialize-vepowertrainsandfuels
This module processes vehicle and fuel characteristics files that model users may optionally supply. When these files are supplied, modules in the package that compute carbon intensities of vehicle travel will use the user-supplied data instead of the datasets that are part of the package (see the LoadDefaultValues.R script).
11.4.27.1 User Input Files
Carbon intensity of electricity (azone_electricity_carbon_intensity.csv)
Average fuel carbon intensity of transit (marea_transit_ave_fuel_carbon_intensity.csv)
Biofuels proportions of transit fuels (marea_transit_biofuel_mix.csv)
Transit fuels proportions by transit vehicle type (marea_transit_fuel.csv)
Transit powertrain proportions by transit vehicle type (marea_transit_powertrain_prop.csv)
Average carbon intensities of fuels by vehicle category for the model region (region_ave_fuel_carbon_intensity.csv)
Car service vehicle powertrain proportions by vehicle type for the model region (region_carsvc_powertrain_prop.csv)
Commercial service vehicle powertrain proportions by vehicle type (region_comsvc_powertrain_prop.csv)
Heavy duty truck powertrain proportions (region_hvytrk_powertrain_prop.csv)
11.4.27.3 Module Outputs
This module produces no datasets to store in the datastore.
For more information see here
11.4.28 CalculateCarbonIntensity
This module calculates the average carbon intensity of fuels (grams CO2e per megajoule) by transportation mode and vehicle type. The transportation modes and vehicle types are:
| Mode | Vehicle Types |
|---|---|
| Household | automobile, light truck |
| Car Service | automobile, light truck |
| Commercial Service | automobile, light truck |
| Heavy Truck | heavy truck |
| Public Transit | van, bus, rail |
Average fuel carbon intensities for public transit vehicles are calculated by Marea. The average fuel carbon intensities for the other mode vehicles are calculated for the entire model region. The module also calculates the average carbon intensity of electricity at the Azone level. Note that this module uses the user input files only if the user runs Initialize module. Otherwise the module uses default inputs in the instfolder.
11.4.28.1 User Input Files
Carbon intensity of electricity (azone_electricity_carbon_intensity.csv)
Biofuels proportions of transit fuels (marea_transit_biofuel_mix.csv)
Transit fuels proportions by transit vehicle type (marea_transit_fuel.csv)
Average carbon intensities of fuels by vehicle category for the model region (region_ave_fuel_carbon_intensity.csv)
11.4.28.3 Module Outputs
- ElectricityCI: Carbon intensity of electricity at point of consumption (grams CO2e per megajoule)
- HhAutoFuelCI: Average carbon intensity of fuels used by household automobiles (grams CO2e per megajoule)
- HhLtTrkFuelCI: Average carbon intensity of fuels used by household light trucks (grams CO2e per megajoule)
- CarSvcAutoFuelCI: Average carbon intensity of fuels used by car service automobiles (grams CO2e per megajoule)
- CarSvcLtTrkFuelCI: Average carbon intensity of fuels used by car service light trucks (grams CO2e per megajoule)
- ComSvcAutoFuelCI: Average carbon intensity of fuels used by commercial service automobiles (grams CO2e per megajoule)
- ComSvcLtTrkFuelCI: Average carbon intensity of fuels used by commercial service light trucks (grams CO2e per megajoule)
- HvyTrkFuelCI: Average carbon intensity of fuels used by heavy trucks (grams CO2e per megajoule)
- TransitVanFuelCI: Average carbon intensity of fuel used by transit vans (grams CO2e per megajoule)
- TransitBusFuelCI: Average carbon intensity of fuel used by transit buses (grams CO2e per megajoule)
- TransitRailFuelCI: Average carbon intensity of fuel used by transit rail vehicles (grams CO2e per megajoule)
For more information see here
11.4.29 AssignHhVehiclePowertrain
This module assigns a powertrain type to each household vehicle. The powertrain types are internal combustion engine vehicle (ICEV), hybrid electric vehicle (HEV), plug-in hybrid electric vehicle (PHEV), and battery electric vehicles (BEV). The module also assigns related characteristics to household vehicles including:
- Battery range (for PHEV and BEV)
- Miles per gallon (MPG) and gallons per mile (GPM)
- Miles per kilowatt-hour (MPKWH) and kilowatt-hours per mile (KWHPM)
- Miles per gasoline gallon equivalent (MPGe)
- The proportion of DVMT powered by electricity
- Carbon dioxide equivalent emissions per mile powered by hydrocarbon fuel
- Carbon dioxide equivalent emissions per mile powered by electricity
11.4.29.1 User Input Files
Charging availability (azone_charging_availability.csv)
Car service vehicle powertrain proportions by vehicle type for the model region (region_carsvc_powertrain_prop.csv)
11.4.29.2 Internal Module Inputs
| Package | Module | Outputs | Description |
|---|---|---|---|
| VEPowertrainsAndFuels | CalculateCarbonIntensity | ElectricityCI | Carbon intensity of electricity at point of consumption (grams CO2e per megajoule) |
| VEPowertrainsAndFuels | CalculateCarbonIntensity | HhAutoFuelCI | Average carbon intensity of fuels used by household automobiles (grams CO2e per megajoule)) |
| VEPowertrainsAndFuels | CalculateCarbonIntensity | HhLtTrkFuelCI | Average carbon intensity of fuels used by household light trucks (grams CO2e per megajoule) |
| VEPowertrainsAndFuels | CalculateCarbonIntensity | CarSvcAutoFuelCI | Average carbon intensity of fuels used by car service automobiles (grams CO2e per megajoule) |
| VEPowertrainsAndFuels | CalculateCarbonIntensity | CarSvcLtTrkFuelCI | Average carbon intensity of fuels used by car service light trucks (grams CO2e per megajoule) |
| ESimHouseholds | CreateHouseholds | HhId | Household id |
| VELandUse | AssignLocTypes | LocType | Location type (Urban, Town, Rural) of the place where the household resides |
| VEHouseholdVehicles | AssignVehicleOwnership | Vehicles | Number of automobiles and light trucks owned or leased by the household including high level car service vehicles available to driving-age persons |
| VEHouseholdVehicles | AssignVehicleType | NumAuto | Number of automobiles (i.e. 4-tire passenger vehicles that are not light trucks) owned or leased by household |
| VEHouseholdVehicles | AssignVehicleType | NumLtTrk | Number of light trucks (pickup, sport-utility vehicle, and van) owned or leased by household |
| VELandUse | PredictHousing | HouseType | Type of dwelling unit of the household |
| VEHouseholdTravel | CalculateHouseholdDvmt | Dvmt | Average daily vehicle miles traveled by the household in autos or light trucks |
| VEHouseholdVehicles | CreateVehicleTable | VehId | Unique vehicle ID |
| VEHouseholdVehicles | AssignVehicleAge | Type | Vehicle body type: Auto = automobile, LtTrk = light trucks (i.e. pickup, SUV, Van) |
| VEHouseholdVehicles | AssignVehicleAge | Age | Vehicle age in years |
| VEHouseholdVehicles | CreateVehicleTable | VehicleAccess | Identifier whether vehicle is owned by household (Own), if vehicle is low level car service (LowCarSvc), or if vehicle is high level car service (HighCarSvc) |
11.4.29.3 Module Outputs
- Powertrain: Vehicle powertrain type: ICEV = internal combustion engine vehicle, HEV = hybrid electric vehicle, PHEV = plug-in hybrid electric vehicle, BEV = battery electric vehicle, NA = not applicable because is a car service vehicle
- BatRng: Miles of travel possible on fully charged battery
- MPG: Average miles of vehicle travel powered by fuel per gasoline equivalent gallon
- GPM: Average gasoline equivalent gallons per mile of vehicle travel powered by fuel
- MPKWH: Average miles of vehicle travel powered by electricity per kilowatt-hour
- KWHPM: Average kilowatt-hours per mile of vehicle travel powered by electricity
- MPGe: Average miles of vehicle travel per gasoline equivalent gallon (fuel and electric powered)
- ElecDvmtProp: Average miles of vehicle travel per gasoline equivalent gallon (fuel and electric powered)
- FuelCO2ePM: Average grams of carbon-dioxide equivalents produced per mile of travel powered by fuel
- ElecCO2ePM: Average grams of carbon-dioxide equivalents produced per mile of travel powered by electricity
For more information see here
11.4.30 Initialize-vetravelperformance
This module reads and processes roadway DVMT and operations inputs.
The following input files are optional. If these data are not provided, the model calculates values based on default data included with the package and processed by the LoadDefaultRoadDvmtValues.R script.
11.4.30.1 User Input Files
Base year highway truck DVMT for region (region_base_year_hvytrk_dvmt.csv)
Base year DVMT for Marea (marea_base_year_dvmt.csv)
- DVMT split by road class by Marea (marea_dvmt_split_by_road_class.csv)
Operations deployment effects on dvmt for Marea (marea_operations_deployment.csv)
Other operations effects (other_ops_effectiveness.csv)
Charges by congestion levels by road class (marea_congestion_charges.csv)
11.4.31 CalculateBaseRoadDvmt
This module calculates base year roadway DVMT by vehicle type (light-duty, heavy truck, bus) and the distribution of roadway DVMT by vehicle type to roadway classes (freeway, arterial, other) This module uses optional user inputs if Initialize module is run. Otherwise, it uses default data in instfolder
11.4.31.1 User Input Files
Base year highway truck DVMT for region (region_base_year_hvytrk_dvmt.csv)
Base year DVMT for Marea (marea_base_year_dvmt.csv)
DVMT split by road class by Marea (marea_dvmt_split_by_road_class.csv)
11.4.31.2 Internal Module Inputs
| Package | Module | Outputs | Description |
|---|---|---|---|
| VETransportSupply | AssignTransitService | VanDvmt | Total daily miles traveled by vans of various sizes to provide demand responsive, vanpool, and similar services |
| VETransportSupply | AssignTransitService | BusDvmt | Total daily miles traveled by buses of various sizes to provide bus service of various types |
| VETransportSupply | AssignTransitService | RailDvmt | Total daily miles traveled by light rail, heavy rail, commuter rail, and similar types of vehicles |
| VELandUse | AssignLocTypes | UrbanPop | Urbanized area population |
| VELandUse | AssignLocTypes | RuralPop | Rural (i.e. non-urbanized area) population |
| VELandUse | AssignLocTypes | RuralIncome | Total household income of the rural (i.e. non-urbanized area) population |
| VELandUse | AssignLocTypes | UrbanIncome | Total household income of the rural (i.e. non-urbanized area) population |
| VEHouseholdTravel | CalculateHouseholdDvmt | UrbanHhDvmt | Average daily vehicle miles traveled in autos or light trucks by households residing in the urbanized portion of the Marea |
| VEHouseholdTravel | CalculateHouseholdDvmt | RuralHhDvmt | Average daily vehicle miles traveled in autos or light trucks by households residing in the rural (non-urban) portion of the Marea |
11.4.31.3 Module Outputs
- HvyTrkDvmtUrbanProp: Proportion of Region heavy truck daily vehicle miles of travel occurring on urbanized area roadways
- HvyTrkDvmtIncomeFactor: Ratio of Region base year heavy truck DVMT to household income
- HvyTrkDvmtPopulationFactor: Ratio of Region base year heavy truck DVMT to population
- HvyTrkUrbanDvmt: Base year Region heavy truck daily vehicle miles of travel in urbanized areas
- HvyTrkRuralDvmt: Base year Region heavy truck daily vehicle miles of travel in rural (i.e. non-urbanized) areas
- ComSvcDvmtHhDvmtFactor: Ratio of Marea base year commercial service DVMT to household DVMT
- ComSvcDvmtIncomeFactor: Ratio of base year commercial service vehicle DVMT to household income
- ComSvcDvmtPopulationFactor: Ratio of base year commercial service vehicle DVMT to population
- HvyTrkDvmtPopulationFactor: Ratio of base year heavy truck DVMT to population
- LdvRoadDvmtLdvDemandRatio: Ratio between light-duty vehicle (LDV) daily vehicle miles of travel (DVMT) on urbanized area roadways in the Marea to the total LDV DVMT of households residing in the urbanized area, the commercial service vehicle travel related to household demand, and LDV public transit DVMT.
- ComSvcUrbanDvmt: Commercial service daily vehicle miles of travel associated with Marea urbanized household activity
- ComSvcRuralDvmt: Commercial service daily vehicle miles of travel associated with Marea rural household activity
- LdvFwyArtDvmtProp: Proportion of light-duty daily vehicle miles of travel in the urbanized portion of the Marea occurring on freeway or arterial roadways
- LdvOthDvmtProp: Proportion of light-duty daily vehicle miles of travel in the urbanized portion of the Marea occurring on other roadways
- HvyTrkFwyDvmtProp: Proportion of heavy truck daily vehicle miles of travel in the urbanized portion of the Marea occurring on freeways
- HvyTrkArtDvmtProp: Proportion of heavy truck daily vehicle miles of travel in the urbanized portion of the Marea occurring on arterial roadways
- HvyTrkOthDvmtProp: Proportion of heavy truck daily vehicle miles of travel in the urbanized portion of the Marea occurring on other roadways
- BusFwyDvmtProp: Proportion of bus daily vehicle miles of travel in the urbanized portion of the Marea occurring on freeways
- BusArtDvmtProp: Proportion of bus daily vehicle miles of travel in the urbanized portion of the Marea occurring on arterial roadways
- BusOthDvmtProp: Proportion of bus daily vehicle miles of travel in the urbanized portion of the Marea occuring on other roadways
- LdvFwyArtDvmt: Light-duty daily vehicle miles of travel in the urbanized portion of the Marea occurring on freeway or arterial roadways
- LdvOthDvmt: Light-duty daily vehicle miles of travel in the urbanized portion of the Marea occurring on other roadways
- HvyTrkFwyDvmt: Heavy truck daily vehicle miles of travel in the urbanized portion of the Marea occurring on freeways
- HvyTrkArtDvmt:Heavy truck daily vehicle miles of travel in the urbanized portion of the Marea occurring on arterial roadways
- HvyTrkOthDvmt: Heavy truck daily vehicle miles of travel in the urbanized portion of the Marea occurring on other roadways
- BusFwyDvmt: Bus daily vehicle miles of travel in the urbanized portion of the Marea occurring on freeways
- BusArtDvmt: Bus daily vehicle miles of travel in the urbanized portion of the Marea occurring on arterial roadways
- BusOthDvmt: Bus daily vehicle miles of travel in the urbanized portion of the Marea occuring on other roadways
11.4.32 CalculateFutureRoadDvmt
This module calculates future year roadway DVMT by vehicle type (light-duty, heavy truck, bus) and the distribution of roadway DVMT by vehicle type to roadway classes (freeway, arterial, other) This module uses optional user inputs if Initialize module is run. Otherwise, it uses default data in instfolder
11.4.32.1 User Input Files
Base year highway truck DVMT for region (region_base_year_hvytrk_dvmt.csv)
Base year DVMT for Marea (marea_base_year_dvmt.csv)
11.4.32.2 Internal Module Inputs
| Package | Module | Outputs | Description |
|---|---|---|---|
| VETravelPerformance | CalculateBaseRoadDvmt | HvyTrkDvmtIncomeFactor | Ratio of Region base year heavy truck DVMT to household income |
| vetravelperformance | CalculateBaseRoadDvmt | HvyTrkDvmtUrbanProp | proportion of region heavy truck daily vehicle miles of travel occurring on urbanized area roadways |
| VETravelPerformance | CalculateBaseRoadDvmt | HvyTrkDvmtPopulationFactor | Ratio of Region base year heavy truck DVMT to population |
| VETravelPerformance | CalculateBaseRoadDvmt | LdvFwyArtDvmtProp | Proportion of light-duty daily vehicle miles of travel in the urbanized portion of the Marea occurring on freeway or arterial roadways |
| VETravelPerformance | CalculateBaseRoadDvmt | LdvOthDvmtProp | Proportion of light-duty daily vehicle miles of travel in the urbanized portion of the Marea occurring on other roadways |
| VETravelPerformance | CalculateBaseRoadDvmt | HvyTrkFwyDvmtProp | Proportion of heavy truck daily vehicle miles of travel in the urbanized portion of the Marea occurring on freeways |
| VETravelPerformance | CalculateBaseRoadDvmt | LdvOthDvmtProp | Proportion of heavy truck daily vehicle miles of travel in the urbanized portion of the Marea occurring on freeways |
| VETravelPerformance | CalculateBaseRoadDvmt | HvyTrkFwyDvmtProp | Proportion of heavy truck daily vehicle miles of travel in the urbanized portion of the Marea occurring on arterial roadways |
| VETravelPerformance | CalculateBaseRoadDvmt | HvyTrkArtDvmtProp | Proportion of heavy truck daily vehicle miles of travel in the urbanized portion of the Marea occurring on arterial roadways |
| VETravelPerformance | CalculateBaseRoadDvmt | HvyTrkOthDvmtProp | Proportion of heavy truck daily vehicle miles of travel in the urbanized portion of the Marea occurring on other roadways |
| VETravelPerformance | CalculateBaseRoadDvmt | BusFwyDvmtProp | Proportion of bus daily vehicle miles of travel in the urbanized portion of the Marea occurring on freeways |
| VETravelPerformance | CalculateBaseRoadDvmt | BusArtDvmtProp | Proportion of bus daily vehicle miles of travel in the urbanized portion of the Marea occurring on arterial roadways |
| VETravelPerformance | CalculateBaseRoadDvmt | BusOthDvmtProp | Proportion of bus daily vehicle miles of travel in the urbanized portion of the Marea occuring on other roadways |
| VETravelPerformance | CalculateBaseRoadDvmt | ComSvcDvmtHhDvmtFactor | Ratio of Marea base year commercial service DVMT to household DVMT |
| VETravelPerformance | CalculateBaseRoadDvmt | ComSvcDvmtIncomeFactor | Ratio of base year commercial service vehicle DVMT to household income |
| VELandUse | CalculateBaseRoadDvmt | ComSvcDvmtPopulationFactor | Ratio of base year commercial service vehicle DVMT to population |
| VELandUse | CalculateBaseRoadDvmt | HvyTrkDvmtPopulationFactor | Ratio of base year heavy truck DVMT to population |
| VELandUse | CalculateBaseRoadDvmt | LdvRoadDvmtLdvDemandRatio | Ratio between light-duty vehicle (LDV) daily vehicle miles of travel (DVMT) on urbanized area roadways in the Marea to the total LDV DVMT of households residing in the urbanized area, the commercial service vehicle travel related to household demand, and LDV public transit DVMT |
| VETransportSupply | AssignTransitService | VanDvmt | Total daily miles traveled by vans of various sizes to provide demand responsive, vanpool, and similar services |
| VETransportSupply | AssignTransitService | BusDvmt | Total daily miles traveled by buses of various sizes to provide bus service of various types |
| VELandUse | AssignLocTypes | UrbanPop | Urbanized area population |
| VELandUse | AssignLocTypes | RuralPop | Rural (i.e. non-urbanized area) population |
| VELandUse | AssignLocTypes | RuralIncome | Total household income of the rural (i.e. non-urbanized area) population |
| VELandUse | AssignLocTypes | UrbanIncome | Total household income of the rural (i.e. non-urbanized area) population |
| VEHouseholdTravel | CalculateHouseholdDvmt | UrbanHhDvmt | Average daily vehicle miles traveled in autos or light trucks by households residing in the urbanized portion of the Marea |
| VEHouseholdTravel | CalculateHouseholdDvmt | RuralHhDvmt | Average daily vehicle miles traveled in autos or light trucks by households residing in the rural (non-urban) portion of the Marea |
11.4.32.3 Module Outputs
- HvyTrkUrbanDvmt: Base year Region heavy truck daily vehicle miles of travel in urbanized areas
- HvyTrkRuralDvmt: Base year Region heavy truck daily vehicle miles of travel in rural (i.e. non-urbanized) areas
- ComSvcUrbanDvmt: Commercial service daily vehicle miles of travel associated with Marea urbanized household activity
- ComSvcRuralDvmt: Commercial service daily vehicle miles of travel associated with Marea rural household activity
- LdvFwyArtDvmt: Light-duty daily vehicle miles of travel in the urbanized portion of the Marea occurring on freeway or arterial roadways
- LdvOthDvmt: Light-duty daily vehicle miles of travel in the urbanized portion of the Marea occurring on other roadways
- HvyTrkFwyDvmt: Heavy truck daily vehicle miles of travel in the urbanized portion of the Marea occurring on freeways
- HvyTrkArtDvmt:Heavy truck daily vehicle miles of travel in the urbanized portion of the Marea occurring on arterial roadways
- HvyTrkOthDvmt: Heavy truck daily vehicle miles of travel in the urbanized portion of the Marea occurring on other roadways
- BusFwyDvmt: Bus daily vehicle miles of travel in the urbanized portion of the Marea occurring on freeways
- BusArtDvmt: Bus daily vehicle miles of travel in the urbanized portion of the Marea occurring on arterial roadways
- BusOthDvmt: Bus daily vehicle miles of travel in the urbanized portion of the Marea occuring on other roadways
11.4.33 CalculateRoadPerformance
This module splits light-duty vehicle (LDV) daily vehicle miles of travel DVHT between freeways and arterials as a function of relative speeds and congestion prices. Speeds and prices are combined to calculate an average ‘effective’ speed for freeways and for arterials. The ratio of freeway and arterial ‘effective’ speeds and a split factor calculated for the metropolitan area are used to split the LDV DVMT. Iteration is used to find an equilibrium split value. In addition to the LDV freeway DVMT and arterial DVMT, the following performance measures are saved to the datastore:
- Average freeway speed by congestion level;
- Average arterial speed by congestion level;
- Average freeway delay by congestion level;
- Average arterial delay by congestion level;
- Freeway DVMT proportions by congestion level;
- Arterial DVMT proportions by congestion level;
- Average amount paid per mile in congestion pricing fees; and,
- Vehicle hours of delay by vehicle type.
11.4.33.1 User Input Files
Operations deployment effects on dvmt for Marea (marea_operations_deployment.csv)
Other operations effects (other_ops_effectiveness.csv)
Charges by congestion levels by road class (marea_congestion_charges.csv)
11.4.33.2 User Input Parameters
Value of time (valueoftime) : This parameter set the value of time (base cost year dollars per hour). It should be defined in model_parameters.json
{"NAME": "ValueOfTime",
"VALUE": "16",
"TYPE": "double",
"UNITS": "base cost year dollars per hour"
}
11.4.33.3 Internal Module Inputs
| Package | Module | Outputs | Description |
|---|---|---|---|
| VELandUse | AssignLocTypes | UrbanPop | Urbanized area population |
| VETransportSupply | AssignRoadMiles | FwyLaneMi | Lane-miles of roadways functionally classified as freeways or expressways in the urbanized portion of the metropolitan area |
| VETravelPerformance | CalculateBaseRoadDvmt | LdvFwyArtDvmt | Light-duty daily vehicle miles of travel in the urbanized portion of the Marea occurring on freeway or arterial roadways |
| VETravelPerformance | CalculateBaseRoadDvmt | LdvOthDvmt | Light-duty daily vehicle miles of travel in the urbanized portion of the Marea occurring on freeway or arterial roadways |
| VETravelPerformance | CalculateBaseRoadDvmt | HvyTrkFwyDvmt | Heavy truck daily vehicle miles of travel in the urbanized portion of the Marea occurring on freeways |
| VETravelPerformance | CalculateBaseRoadDvmt | HvyTrkArtDvmt | Heavy truck daily vehicle miles of travel in the urbanized portion of the Marea occurring on arterial roadways |
| VETravelPerformance | CalculateBaseRoadDvmt | HvyTrkOthDvmt | Light-duty daily vehicle miles of travel in the urbanized portion of the Marea occurring on other roadways |
| VETravelPerformance | CalculateBaseRoadDvmt | BusFwyDvmt | Bus daily vehicle miles of travel in the urbanized portion of the Marea occurring on freeways |
| VETravelPerformance | CalculateBaseRoadDvmt | BusArtDvmt | Bus daily vehicle miles of travel in the urbanized portion of the Marea occurring on arterial roadways |
| VETravelPerformance | CalculateBaseRoadDvmt | BusOthDvmt | Bus daily vehicle miles of travel in the urbanized portion of the Marea occuring on other roadways |
| VELandUse | Calculate4DMeasures | UrbanArea | Area that is Urban and unprotected (i.e. developable) within the zone |
11.4.33.4 Module Outputs
- LdvFwyDvmt: Light-duty daily vehicle miles of travel in the urbanized portion of the Marea occurring on freeways
- LdvArtDvmt: Light-duty daily vehicle miles of travel in the urbanized portion of the Marea occurring on arterial roadways
- FwyNoneCongSpeed: Average freeway speed (miles per hour) when there is no congestion
- FwyModCongSpeed: Average freeway speed (miles per hour) when congestion is moderate
- FwyHvyCongSpeed: Average freeway speed (miles per hour) when congestion is heavy
- FwySevCongSpeed: Average freeway speed (miles per hour) when congestion is severe
- FwyExtCongSpeed: Average freeway speed (miles per hour) when congestion is extreme
- ArtNoneCongSpeed: Average arterial speed (miles per hour) when there is no congestion
- ArtModCongSpeed: Average arterial speed (miles per hour) when congestion is moderate
- ArtHvyCongSpeed: Average arterial speed (miles per hour) when congestion is heavy
- ArtSevCongSpeed: Average arterial speed (miles per hour) when congestion is severe
- ArtExtCongSpeed: Average arterial speed (miles per hour) when congestion is extreme
- OthSpd: Average speed (miles per hour) on other roadways
- LdvAveSpeed: Average light-duty vehicle speed (miles per hour) on all roadways weighted by the proportions of light-duty vehicle travel
- FwyNoneCongDelay: Average freeway delay (hours per mile) occurring when there is no congestion
- FwyModCongDelay: Average freeway delay (hours per mile) occurring when congestion is moderate
- FwyHvyCongDelay: Average freeway delay (hours per mile) occurring when congestion is heavy
- FwySevCongDelay: Average freeway delay (hours per mile) occurring when congestion is severe
- FwyExtCongDelay: Average freeway delay (hours per mile) occurring when congestion is extreme
- ArtNoneCongDelay: Average arterial delay (hours per mile) occurring when there is no congestion
- ArtModCongDelay: Average arterial delay (hours per mile) occurring when congestion is moderate
- ArtHvyCongDelay: Average arterial delay (hours per mile) occurring when congestion is heavy
- ArtSevCongDelay: Average arterial delay (hours per mile) occurring when congestion is severe
- ArtExtCongDelay: Average arterial delay (hours per mile) occurring when congestion is extreme
- FwyDvmtPropNoneCong: Proportion of freeway DVMT occurring when there is no congestion
- FwyDvmtPropModCong: Proportion of freeway DVMT occurring when congestion is moderate
- FwyDvmtPropHvyCong: Proportion of freeway DVMT occurring when congestion is heavy
- FwyDvmtPropSevCong: Proportion of freeway DVMT occurring when congestion is severe
- FwyDvmtPropExtCong: Proportion of freeway DVMT occurring when congestion is extreme
- ArtDvmtPropNoneCong: Proportion of arterial DVMT occurring when there is no congestion
- ArtDvmtPropModCong: Proportion of arterial DVMT occurring when congestion is moderate
- ArtDvmtPropHvyCong: Proportion of arterial DVMT occurring when congestion is heavy
- ArtDvmtPropSevCong: Proportion of arterial DVMT occurring when congestion is severe
- ArtDvmtPropExtCong: Proportion of arterial DVMT occurring when congestion is extreme
- AveCongPrice: Average price paid (dollars per mile) in congestion fees
For more information see here
11.4.34 CalculateMpgMpkwhAdjustments
This module calculates adjustments to fuel economy and electric energy economy for plug-in vehicles) resulting from traffic congestion, speed smoothing(i.e. active traffic management which reduces speed variation), and ecodriving practices.
11.4.34.1 User Input Files
- Speed smoothing and eco-driving (marea_speed_smooth_ecodrive.csv)
11.4.34.2 Internal Module Inputs
| Package | Module | Outputs | Description |
|---|---|---|---|
| VETravelPerformance | CalculateRoadPerformance | LdvFwyDvmt | Light-duty daily vehicle miles of travel in the urbanized portion of the Marea occurring on freeways |
| VETravelPerformance | CalculateRoadPerformance | LdvArtDvmt | Light-duty daily vehicle miles of travel in the urbanized portion of the Marea occurring on arterial roadways |
| VETravelPerformance | CalculateBaseRoadDvmt | LdvOthDvmt | Light-duty daily vehicle miles of travel in the urbanized portion of the Marea occurring on freeway or arterial roadways |
| VETravelPerformance | CalculateBaseRoadDvmt | HvyTrkFwyDvmt | Heavy truck daily vehicle miles of travel in the urbanized portion of the Marea occurring on freeways |
| VETravelPerformance | CalculateBaseRoadDvmt | HvyTrkArtDvmt | Heavy truck daily vehicle miles of travel in the urbanized portion of the Marea occurring on arterial roadways |
| VETravelPerformance | CalculateBaseRoadDvmt | HvyTrkOthDvmt | Light-duty daily vehicle miles of travel in the urbanized portion of the Marea occurring on other roadways |
| VETravelPerformance | CalculateBaseRoadDvmt | BusFwyDvmt | Bus daily vehicle miles of travel in the urbanized portion of the Marea occurring on freeways |
| VETravelPerformance | CalculateBaseRoadDvmt | BusArtDvmt | Bus daily vehicle miles of travel in the urbanized portion of the Marea occurring on arterial roadways |
| VETravelPerformance | CalculateBaseRoadDvmt | BusOthDvmt | Bus daily vehicle miles of travel in the urbanized portion of the Marea occuring on other roadways |
| VETravelPerformance | CalculateRoadPerformance | FwyNoneCongSpeed | Average freeway speed (miles per hour) when there is no congestion |
| VETravelPerformance | CalculateRoadPerformance | FwyModCongSpeed | Light-duty daily vehicle miles of travel in the urbanized portion of the Marea occurring on arterial roadways |
| VETravelPerformance | CalculateRoadPerformance | FwyHvyCongSpeed | Average freeway speed (miles per hour) when congestion is heavy |
| VETravelPerformance | CalculateRoadPerformance | FwySevCongSpeed | Average freeway speed (miles per hour) when congestion is severe |
| VETravelPerformance | CalculateRoadPerformance | FwyExtCongSpeed | Light-duty daily vehicle miles of travel in the urbanized portion of the Marea occurring on other roadways |
| VETravelPerformance | CalculateRoadPerformance | BusFwyDvmt | Bus daily vehicle miles of travel in the urbanized portion of the Marea occurring on freeways |
| VETravelPerformance | CalculateRoadPerformance | BusArtDvmt | Bus daily vehicle miles of travel in the urbanized portion of the Marea occurring on arterial roadways |
| VETravelPerformance | CalculateRoadPerformance | BusOthDvmt | Bus daily vehicle miles of travel in the urbanized portion of the Marea occuring on other roadways |
| VETravelPerformance | CalculateRoadPerformance | FwyDvmtPropNoneCong | Proportion of freeway DVMT occurring when there is no congestion |
| VETravelPerformance | CalculateRoadPerformance | FwyDvmtPropModCong | Proportion of freeway DVMT occurring when congestion is moderate |
| VETravelPerformance | CalculateRoadPerformance | FwyDvmtPropHvyCong | Proportion of freeway DVMT occurring when congestion is heavy |
| VETravelPerformance | CalculateRoadPerformance | FwyDvmtPropSevCong | Proportion of freeway DVMT occurring when congestion is severe |
| VETravelPerformance | CalculateRoadPerformance | FwyDvmtPropExtCong | Proportion of freeway DVMT occurring when congestion is extreme |
| VETravelPerformance | CalculateRoadPerformance | ArtDvmtPropNoneCong | Proportion of arterial DVMT occurring when there is no congestion |
| VETravelPerformance | CalculateRoadPerformance | ArtDvmtPropModCong | Proportion of arterial DVMT occurring when congestion is moderate |
| VETravelPerformance | CalculateRoadPerformance | ArtDvmtPropHvyCong | Proportion of arterial DVMT occurring when congestion is heavy |
| VETravelPerformance | CalculateRoadPerformance | ArtDvmtPropSevCong | Proportion of arterial DVMT occurring when congestion is severe |
| VETravelPerformance | CalculateRoadPerformance | ArtDvmtPropExtCong | Proportion of arterial DVMT occurring when congestion is extereme |
11.4.34.3 Module Outputs
- LdvSpdSmoothFactor: Proportional adjustment of light-duty internal combustion engine (ICE) vehicle MPG due to speed smoothing
- HvyTrkSpdSmoothFactor: Proportional adjustment of heavy truck internal combustion engine (ICE) vehicle MPG due to speed smoothing
- BusSpdSmoothFactor: Proportional adjustment of bus internal combustion engine (ICE) vehicle MPG due to speed smoothing
- LdvEcoDriveFactor: Proportional adjustment of light-duty internal combustion engine (ICE) vehicle MPG due to eco-driving
- HvyTrkEcoDriveFactor: Proportional adjustment of heavy truck internal combustion engine (ICE) vehicle MPG due to eco-driving
- BusEcoDriveFactor: Proportional adjustment of bus internal combustion engine (ICE) vehicle MPG due to eco-driving
- LdIceFactor: Proportional adjustment of light-duty internal combustion engine (ICE) vehicle MPG due to congestion
- LdHevFactor: Proportional adjustment of light-duty hybrid-electric vehicle (HEV) MPG due to congestion
- LdEvFactor: Proportional adjustment of light-duty battery electric vehicle (EV) MPkWh due to congestion
- LdFcvFactor: Proportional adjustment of light-duty fuel cell vehicle (FCV) MPkWh due to congestion
- HdIceFactor: Proportional adjustment of heavy-duty internal combustion engine (ICE) vehicle MPG due to congestion
11.4.35 AdjustHhVehicleMpgMpkwh
This module adjusts the fuel economy and power efficiency of household vehicles to reflect roadway congestion.
11.4.35.1 User Input Files
- Car service vehicle powertrain proportions by vehicle type for the model region (region_carsvc_powertrain_prop.csv)
11.4.35.2 Internal Module Inputs
| Package | Module | Outputs | Description |
|---|---|---|---|
| VETravelPerformance | CalculateMpgMpkwhAdjustments | LdvEcoDrive | Eco-driving penetration for light-duty vehicles; the fraction of vehicles from 0 to 1 |
| VETravelPerformance | CalculateMpgMpkwhAdjustments | LdvSpdSmoothFactor | Proportional adjustment of light-duty internal combustion engine (ICE) vehicle MPG due to speed smoothing |
| VETravelPerformance | CalculateMpgMpkwhAdjustments | LdvEcoDriveFactor | Proportional adjustment of light-duty internal combustion engine (ICE) vehicle MPG due to eco-driving |
| VETravelPerformance | CalculateMpgMpkwhAdjustments | LdIceFactor | Proportional adjustment of light-duty internal combustion engine (ICE) vehicle MPG due to congestion |
| VETravelPerformance | CalculateMpgMpkwhAdjustments | LdHevFactor | Proportional adjustment of light-duty hybrid-electric vehicle (HEV) MPG due to congestion |
| VETravelPerformance | CalculateMpgMpkwhAdjustments | LdFcvFactor | Proportional adjustment of light-duty fuel cell vehicle (FCV) MPkWh due to congestion |
| VESimHouseholds | CreateHouseholds | HhId | Household id |
| VELandUse | AssignLocTypes | LocType | Location type (Urban, Town, Rural) of the place where the household resides |
| VEHouseholdVehicles | AssignVehicleOwnership | Vehicles | Number of automobiles and light trucks owned or leased by the household including high level car service vehicles available to driving-age persons |
| VEHouseholdVehicles | AssignVehicleType | NumLtTrk | Number of light trucks (pickup, sport-utility vehicle, and van) owned or leased by household |
| VEHouseholdVehicles | AssignVehicleType | NumAuto | Number of automobiles (i.e. 4-tire passenger vehicles that are not light trucks) owned or leased by household |
| VEHouseholdTravel | CalculateHouseholdDvmt | Dvmt | Average daily vehicle miles traveled by the household in autos or light trucks |
| VEHouseholdVehicles | AssignVehicleAge | Type | Vehicle body type: Auto = automobile, LtTrk = light trucks (i.e. pickup, SUV, Van) |
| VEPowertrainsAndFuels | AssignHhVehiclePowertrain | Powertrain | Vehicle powertrain type: ICEV = internal combustion engine vehicle, HEV = hybrid electric vehicle, PHEV = plug-in hybrid electric vehicle, BEV = battery electric vehicle, NA = not applicable because is a car service vehicle |
| VEHouseholdVehicles | CreateVehicleTable | VehicleAccess | Identifier whether vehicle is owned by household (Own), if vehicle is low level car service (LowCarSvc), or if vehicle is high level car service (HighCarSvc) |
| VEPowertrainsAndFuels | AssignHhVehiclePowertrain | MPG | Average miles of vehicle travel powered by fuel per gasoline equivalent gallon |
| VEPowertrainsAndFuels | AssignHhVehiclePowertrain | GPM | Average gasoline equivalent gallons per mile of vehicle travel powered by fuel |
| VEPowertrainsAndFuels | AssignHhVehiclePowertrain | MPKWH | Average miles of vehicle travel powered by electricity per kilowatt-hour |
| VEPowertrainsAndFuels | AssignHhVehiclePowertrain | KWHPM | Average kilowatt-hours per mile of vehicle travel powered by electricity |
| VEPowertrainsAndFuels | AssignHhVehiclePowertrain | MPGe | Average miles of vehicle travel per gasoline equivalent gallon (fuel and electric powered) |
| VEPowertrainsAndFuels | AssignHhVehiclePowertrain | ElecDvmtProp | Average miles of vehicle travel per gasoline equivalent gallon (fuel and electric powered) |
| VEPowertrainsAndFuels | AssignHhVehiclePowertrain | FuelCO2ePM | Average grams of carbon-dioxide equivalents produced per mile of travel powered by fuel |
| VEPowertrainsAndFuels | AssignHhVehiclePowertrain | ElecCO2ePM | Average grams of carbon-dioxide equivalents produced per mile of travel powered by electricity |
11.4.35.3 Module Outputs
- MPG: Average miles of vehicle travel powered by fuel per gasoline equivalent gallon
- GPM: Average gasoline equivalent gallons per mile of vehicle travel powered by fuel
- MPKWH: Average miles of vehicle travel powered by electricity per kilowatt-hour
- KWHPM: Average kilowatt-hours per mile of vehicle travel powered by electricity
- MPGe: Average miles of vehicle travel per gasoline equivalent gallon (fuel and electric powered)
- ElecDvmtProp: Average miles of vehicle travel per gasoline equivalent gallon (fuel and electric powered)
- FuelCO2ePM: Average grams of carbon-dioxide equivalents produced per mile of travel powered by fuel
- IsEcoDrive: Flag identifying whether drivers in household are eco-drivers
11.4.36 CalculateVehicleOperatingCost
This module calculates vehicle operating costs per mile of travel and uses those costs to determine the proportional split of DVMT among household vehicles. The module also calculates the average out-of-pocket costs per mile of vehicle by household, as well as the cost of social and environmental impacts, and road use taxes per mile of vehicle travel.
11.4.36.1 User Input Files
Vehicle access times (azone_vehicle_access_times.csv)
Fuel and electricity costs for household vehicles (azone_fuel_power_cost.csv
Vehicle operating taxes for households (azone_veh_use_taxes.csv
Proportional external costs for the region (region_prop_externalities_paid.csv
11.4.36.2 User Input Parameters
Value of time (valueoftime) : This parameter set the value of time (base cost year dollars per hour). It should be defined in model_parameters.json
{"NAME": "ValueOfTime",
"VALUE": "16",
"TYPE": "double",
"UNITS": "base cost year dollars per hour"
}
11.4.36.3 Internal Module Inputs
| Package | Module | Outputs | Description |
|---|---|---|---|
| VETravelPerformance | CalculateRoadPerformance | LdvAveSpeed | Average light-duty vehicle speed (miles per hour) on all roadways weighted by the proportions of light-duty vehicle travel |
| VETravelPerformance | CalculateRoadPerformance | AveCongPrice | Average price paid (dollars per mile) in congestion fees |
| VEHouseholdVehicles | CreateVehicleTable | HighCarSvcCost | Average cost in dollars per mile for travel by high service level car service |
| VEHouseholdVehicles | CreateVehicleTable | LowCarSvcCost | Average cost in dollars per mile for travel by low service level car service |
| VESimHouseholds | CreateHouseholds | HhId | Household id |
| VEHouseholdVehicles | CreateVehicleTable | VehId | Unique vehicle ID |
| VESimHouseholds | PredictIncome | Income | Total annual income of household |
| VEHouseholdTravel | CalculateHouseholdDvmt | Dvmt | Average daily vehicle miles traveled by the household in autos or light trucks |
| VEHouseholdVehicles | CalculateVehicleOwnCost | HasPaydIns | Identifies whether household has pay-as-you-drive insurance for vehicles: 1 = Yes, 0 = no |
| VEHouseholdTravel | CalculateVehicleTrips | VehicleTrips | Average number of vehicle trips per day by household members |
| VELandUse | AssignParkingRestrictions | OtherParkingCost | Daily cost for parking at shopping locations or other locations of paid parking not including work |
| VEHouseholdVehicles | AssignVehicleAge | Type | Vehicle body type: Auto = automobile, LtTrk = light trucks (i.e. pickup, SUV, Van) |
| VEHouseholdVehicles | AssignVehicleAge | Age | Vehicle age in years |
| VEHouseholdVehicles | CreateVehicleTable | VehicleAccess | Identifier whether vehicle is owned by household (Own), if vehicle is low level car service (LowCarSvc), or if vehicle is high level car service (HighCarSvc) |
| VEPowertrainsAndFuels | AssignHhVehiclePowertrain | Powertrain | Vehicle powertrain type: ICEV = internal combustion engine vehicle, HEV = hybrid electric vehicle, PHEV = plug-in hybrid electric vehicle, BEV = battery electric vehicle, NA = not applicable because is a car service vehicle |
| VEPowertrainsAndFuels | AssignHhVehiclePowertrain | GPM | Average gasoline equivalent gallons per mile of vehicle travel powered by fuel |
| VEPowertrainsAndFuels | AssignHhVehiclePowertrain | KWHPM | Average kilowatt-hours per mile of vehicle travel powered by electricity |
| VEPowertrainsAndFuels | AssignHhVehiclePowertrain | ElecDvmtProp | Average miles of vehicle travel per gasoline equivalent gallon (fuel and electric powered) |
| VEPowertrainsAndFuels | AssignHhVehiclePowertrain | FuelCO2ePM | Average grams of carbon-dioxide equivalents produced per mile of travel powered by fuel |
| VEPowertrainsAndFuels | AssignHhVehiclePowertrain | ElecCO2ePM | Average grams of carbon-dioxide equivalents produced per mile of travel powered by electricity |
| VEHouseholdVehicles | CalculateVehicleOwnCost | InsCost | Annual vehicle insurance cost in dollars |
| VELandUse | AssignParkingRestrictions | ParkingCost | Daily cost for long-term parking (e.g. paid on monthly basis) |
| VELandUse | AssignParkingRestrictions | IsCashOut | Is worker paid parking in cash-out-buy-back program: 1 = yes, 0 = no |
| VELandUse | AssignParkingRestrictions | PaysForParking | Does worker pay for parking: 1 = yes, 0 = no |
11.4.36.4 Module Outputs
- AveVehCostPM: Average out-of-pocket cost in dollars per mile of vehicle travel
- AveSocEnvCostPM: Average cost in dollars of the social and environmental impacts per mile of vehicle travel
- AveRoadUseTaxPM: Average road use taxes in dollars collected per mile of vehicle travel
- DvmtProp: Proportion of household DVMT allocated to vehicle
- AveGPM: Average gasoline equivalent gallons per mile of household vehicle travel
- AveKWHPM: Average kilowatt-hours per mile of household vehicle travel
- AveCO2ePM: Average grams of carbon-dioxide equivalents produced per mile of household vehicle travel
11.4.37 BudgetHouseholdDvmt
This module adjusts average household DVMT to keep the quantity within household operating cost limits. The limit for each household is calculated in several steps. First, the proportion of the household’s income that may be spent on vehicle operating costs is calculated using a model that is explained below. This is called the budget proportion. Then an adjusted household income for budget calculation purposes is calculated by adding the annual cost of insurance for households subscribing to payd-as-you-drive (PAYD) insurance, cash-out parking payments for workers who work at an employer that has cash-out-buy-back parking, and any vehicle ownership cost savings for households that substitute high level car service for one or more household vehicles. The adjusted household income is muliplied by the budget proportion and divided by the average vehicle operating cost per mile for the household to determine the maximum household DVMT that fits within the household budget. The household DVMT is then set at the lesser of this budget maximum or the modeled household DVMT. The budget proportion model is estimated using data from the Bureau of Labor’s consumer expenditure survey for the years from 2003 to 2015. The data used are the nominal dollar expenditures by household income category and year by transportation category. The values for the operating cost categories (gas and oil, and maintenance and repair) are summed and then divided by the midpoint value for each income category to calculate the budget proportion for each income group and each year. From this the mean value is computed for each income group. The budget proportions for each income group and year are divided by the mean values by income group to normalize values. The standard deviation for the combined normalized values is computed and value of 3 deviations above the mean is set as the maximum normalized value. The mean values by income group are multiplied by this normalized maximum to derive a budget proportion maximum by income group. A smoothed splines model of the budget proportion as a function of income is then estimated from the calculated budget proportion maximums. This model is used to calculate the budget proportion for a household based on the household income. The minimum and maximum values of the calculated budget proportion maximums are used as constraints to avoid unreasonable results for very low incomes and very high incomes.
11.4.37.2 Internal Module Inputs
| Package | Module | Outputs | Description |
|---|---|---|---|
| VESimHouseholds | CreateHouseholds | HhId | Household id |
| VESimHouseholds | CreateHouseholds | HHSize | Number of persons in the household |
| VESimHouseholds | PredictIncome | Income | Total annual income of household |
| VELandUse | AssignLocTypes | LocType | Location type (Urban, Town, Rural) of the place where the household resides |
| VETravelPerformance | CalculateVehicleOperatingCost | AveVehCostPM | Average out-of-pocket cost in dollars per mile of vehicle travel |
| VEHouseholdVehicles | AdjustVehicleOwnership | OwnCostSavings | Annual vehicle ownership cost (depreciation, finance, insurance, taxes) savings in dollars resulting from substituting the use of car services for a household vehicle |
| VEHouseholdVehicles | CalculateVehicleOwnCost | HasPaydIns | Identifies whether household has pay-as-you-drive insurance for vehicles: 1 = Yes, 0 = no |
| VETravelPerformance | CalculateVehicleOperatingCost | AveGPM | Average gasoline equivalent gallons per mile of household vehicle travel |
| VETravelPerformance | CalculateVehicleOperatingCost | AveKWHPM | Average kilowatt-hours per mile of household vehicle travel |
| VETravelPerformance | CalculateVehicleOperatingCost | AveCO2ePM | Average grams of carbon-dioxide equivalents produced per mile of household vehicle travel |
| VELandUse | AssignParkingRestrictions | ParkingCost | Daily cost for long-term parking (e.g. paid on monthly basis) |
| VELandUse | AssignParkingRestrictions | IsCashOut | Is worker paid parking in cash-out-buy-back program: 1 = yes, 0 = no |
| VELandUse | AssignParkingRestrictions | PaysForParking | Does worker pay for parking: 1 = yes, 0 = no |
| VEHouseholdVehicles | CalculateVehicleOwnCost | InsCost | Annual vehicle insurance cost in dollars |
11.4.37.3 Module Outputs
- Dvmt: Average daily vehicle miles traveled by the household in autos or light trucks
- UrbanHhDvmt: Average daily vehicle miles traveled in autos or light trucks by households residing in the urbanized portion of the Marea
- RuralHhDvmt: Average daily vehicle miles traveled in autos or light trucks by households residing in the non-urbanized portion of the Marea
- DailyGGE: Gasoline equivalent gallons consumed per day by household vehicle travel
- DailyKWH: Kilowatt-hours consumed per day by household vehicle travel
- DailyCO2e: Grams of carbon-dioxide equivalents produced per day by household vehicle travel
- WalkTrips: Average number of walk trips per year by household members
- BikeTrips: Average number of bicycle trips per year by household members
- TransitTrips: Average number of public transit trips per year by household members
- VehicleTrips: Average number of vehicle trips per day by household members
11.4.38 BalanceRoadCostsAndRevenues
This module calculates an extra mileage tax ($ per vehicle mile traveled) for household vehicles needed to make up any difference in the cost of constructing, maintaining, and operating roadways and the revenues from fuel, VMT, and congestion taxes.
11.4.38.1 User Input Files
- Road cost for the region (region_road_cost.csv)
11.4.38.2 Internal Module Inputs
| Package | Module | Outputs | Description |
|---|---|---|---|
| VETravelPerformance | CalculateBaseRoadDvmt | HvyTrkUrbanDvmt | Base year Region heavy truck daily vehicle miles of travel in urbanized areas |
| VETravelPerformance | CalculateBaseRoadDvmt | ComSvcUrbanDvmt | Commercial service daily vehicle miles of travel associated with Marea urbanized household activity |
| VETravelPerformance | CalculateBaseRoadDvmt | ComSvcRuralDvmt | Commercial service daily vehicle miles of travel associated with Marea rural household activity |
| VETravelPerformance | CalculateBaseRoadDvmt | ComSvcTownDvmt | Commercial service daily vehicle miles of travel associated with Marea town household activity |
| VETransportSupply | AssignRoadMiles | FwyLaneMi | Lane-miles of roadways functionally classified as freeways or expressways in the urbanized portion of the metropolitan area |
| VETransportSupply | AssignRoadMiles | ArtLaneMi | Lane-miles of roadways functionally classified as arterials (but not freeways or expressways) in the urbanized portion of the metropolitan area |
| VETravelPerformance | CalculateVehicleOperatingCost | AveRoadUseTaxPM | Average road use taxes in dollars collected per mile of vehicle travel |
| VETravelPerformance | BudgetHouseholdDvmt | Dvmt | Average daily vehicle miles traveled by the household in autos or light trucks |
11.4.39 CalculateComEnergyAndEmissions
This module calculates the energy consumption and carbon emissions of heavy trucks and light-duty commercial service vehicles. It does not calculate the values for car service vehicles which are calculated as part of the household emissions. It also does not calculate public transit emissions which are calculated in the CalculateTransitEnergyAndEmissions module.
11.4.39.1 User Input Files
Light trucks proportion for commercial service vehicles (region_comsvc_lttrk_prop.csv)
Commercial service vehicle powertrain proportions by vehicle type (region_comsvc_powertrain_prop.csv)
Heavy duty truck powertrain proportions (region_hvytrk_powertrain_prop.csv)
Mean age for commercial service vehicles by vehicle type (region_comsvc_veh_mean_age.csv)
11.4.39.2 Internal Module Inputs
| Package | Module | Outputs | Description |
|---|---|---|---|
| VEPowertrainsAndFuels | CalculateCarbonIntensity | ElectricityCI | Carbon intensity of electricity at point of consumption (grams CO2e per megajoule) |
| VEPowertrainsAndFuels | CalculateCarbonIntensity | HhAutoFuelCI | Average carbon intensity of fuels used by household automobiles (grams CO2e per megajoule)) |
| VEPowertrainsAndFuels | CalculateCarbonIntensity | HhLtTrkFuelCI | Average carbon intensity of fuels used by household light trucks (grams CO2e per megajoule) |
| VEPowertrainsAndFuels | CalculateCarbonIntensity | HvyTrkFuelCI | Average carbon intensity of fuels used by heavy trucks (grams CO2e per megajoule) |
| VETravelPerformance | CalculateMpgMpkwhAdjustments | LdvEcoDrive | Eco-driving penetration for light-duty vehicles; the fraction of vehicles from 0 to 1 |
| VETravelPerformance | CalculateMpgMpkwhAdjustments | HvyTrkEcoDrive | Eco-driving penetration for heavy-duty vehicles; the fraction of vehicles from 0 to 1 |
| VETravelPerformance | CalculateMpgMpkwhAdjustments | LdvSpdSmoothFactor | Proportional adjustment of light-duty internal combustion engine (ICE) vehicle MPG due to speed smoothing |
| VETravelPerformance | CalculateMpgMpkwhAdjustments | LdvEcoDriveFactor | Proportional adjustment of light-duty internal combustion engine (ICE) vehicle MPG due to eco-driving |
| VETravelPerformance | CalculateMpgMpkwhAdjustments | HvyTrkSpdSmoothFactor | Proportional adjustment of heavy truck internal combustion engine (ICE) vehicle MPG due to speed smoothing |
| VETravelPerformance | CalculateMpgMpkwhAdjustments | LdIceFactor | Proportional adjustment of light-duty internal combustion engine (ICE) vehicle MPG due to congestion |
| VETravelPerformance | CalculateMpgMpkwhAdjustments | LdHevFactor | Proportional adjustment of light-duty hybrid-electric vehicle (HEV) MPG due to congestion |
| VETravelPerformance | CalculateMpgMpkwhAdjustments | HvyTrkEcoDriveFactor | Proportional adjustment of heavy truck internal combustion engine (ICE) vehicle MPG due to eco-driving |
| VETravelPerformance | CalculateMpgMpkwhAdjustments | LdEvFactor | Proportional adjustment of light-duty battery electric vehicle (EV) MPkWh due to congestion |
| VETravelPerformance | CalculateMpgMpkwhAdjustments | HdIceFactor | Proportional adjustment of heavy-duty internal combustion engine (ICE) vehicle MPG due to congestion |
| VETravelPerformance | CalculateBaseRoadDvmt | HvyTrkUrbanDvmt | Base year Region heavy truck daily vehicle miles of travel in urbanized areas |
| VETravelPerformance | CalculateBaseRoadDvmt | HvyTrkRuralDvmt | Base year Region heavy truck daily vehicle miles of travel in rural (i.e. non-urbanized) areas |
| VETravelPerformance | CalculateBaseRoadDvmt | ComSvcUrbanDvmt | Commercial service daily vehicle miles of travel associated with Marea urbanized household activity |
| VETravelPerformance | CalculateBaseRoadDvmt | ComSvcRuralDvmt | Commercial service daily vehicle miles of travel associated with Marea rural household activity |
11.4.39.3 Module Outputs
ComSvcUrbanGGE: Average daily amount of hydrocarbon fuels consumed by commercial service vehicles associated with urban household activity in gas gallon equivalents
ComSvcRuralGGE: Average daily amount of hydrocarbon fuels consumed by commercial service vehicles associated with rural household activity in gas gallon equivalents
HvyTrkUrbanGGE: Average daily amount of hydrocarbon fuels consumed by heavy trucks on urbanized area roadways in the Marea in gas gallon equivalents
ComSvcUrbanKWH: Average daily amount of electricity consumed by commercial service vehicles associated with urban household activity in kilowatt-hours
ComSvcRuralKWH: Average daily amount of electricity consumed by commercial service vehicles associated with rural household activity in kilowatt-hours
ComSvcUrbanCO2e: Average daily amount of carbon-dioxide equivalents produced by commercial service vehicles associated with urban household activity in grams
ComSvcRuralCO2e: Average daily amount of carbon-dioxide equivalents produced by commercial service vehicles associated with rural household activity in grams
HvyTrkUrbanCO2e: Average daily amount of carbon-dioxide equivalents produced by heavy trucks on urbanized area roadways in the Marea in grams
ComSvcAveUrbanAutoCO2eRate: Average amount of carbon-dioxide equivalents produced by commercial service automobiles per mile of travel on urbanized area roadways in grams per mile
ComSvcAveUrbanLtTrkCO2eRate: Average amount of carbon-dioxide equivalents produced by commercial service light trucks per mile of travel on urbanized area roadways in grams per mile
HvyTrkAveUrbanCO2eRate: Average amount of carbon-dioxide equivalents produced by heavy trucks per mile of travel on urbanized area roadways in grams per mile
HvyTrkRuralGGE: Average daily amount of hydrocarbon fuels consumed by heavy trucks on rural roadways in the Region in gas gallon equivalents
HvyTrkUrbanGGE: Average daily amount of hydrocarbon fuels consumed by heavy trucks on urbanized area roadways in the Region in gas gallon equivalents
HvyTrkRuralKWH: Average daily amount of electricity consumed by heavy trucks on rural roadways in the Region in kilowatt-hours
HvyTrkUrbanKWH: Average daily amount of electricity consumed by heavy trucks on urbanized area roadways in the Region in kilowatt-hours
HvyTrkRuralCO2e: Average daily amount of carbon-dioxide equivalents produced by heavy trucks on rural roadways in the Region in grams
HvyTrkUrbanCO2e: Average daily amount of carbon-dioxide equivalents produced by heavy trucks on urbanized area roadways in the Region in grams
11.4.40 CalculatePtranEnergyAndEmissions
This module calculates the energy consumption and carbon emissions of public transit vehicle emissions in urbanized areas.
11.4.40.1 User Input Files
- Transit powertrain proportions by transit vehicle type (marea_transit_powertrain_prop.csv)
11.4.40.2 Internal Module Inputs
| Package | Module | Outputs | Description |
|---|---|---|---|
| VEPowertrainsAndFuels | CalculateCarbonIntensity | ElectricityCI | Carbon intensity of electricity at point of consumption (grams CO2e per megajoule) |
| VEPowertrainsAndFuels | CalculateCarbonIntensity | TransitVanFuelCI | Average carbon intensity of fuel used by transit vans (grams CO2e per megajoule) |
| VEPowertrainsAndFuels | CalculateCarbonIntensity | TransitBusFuelCI | Average carbon intensity of fuel used by transit buses (grams CO2e per megajoule) |
| VEPowertrainsAndFuels | CalculateCarbonIntensity | TransitRailFuelCI | Average carbon intensity of fuel used by transit rail vehicles (grams CO2e per megajoule) |
| VETransportSupply | AssignTransitService | VanDvmt | Total daily miles traveled by vans of various sizes to provide demand responsive, vanpool, and similar services |
| VETransportSupply | AssignTransitService | BusDvmt | Total daily miles traveled by buses of various sizes to provide bus service of various types |
| VETransportSupply | AssignTransitService | RailDvmt | Total daily miles traveled by light rail, heavy rail, commuter rail, and similar types of vehicles |
11.4.40.3 Module Outputs
- BusGGE: Average daily amount of hydrocarbon fuels consumed by bus transit vehicles in urbanized area in gas gallon equivalents
- RailGGE: Average daily amount of hydrocarbon fuels consumed by rail transit vehicles in urbanized area in gas gallon equivalents
- VanGGE: Average daily amount of hydrocarbon fuels consumed by van transit vehicles in urbanized area in gas gallon equivalents
- BusKWH: Average daily amount of electricity consumed by bus transit vehicles in urbanized area in kilowatt-hours
- RailKWH: Average daily amount of electricity consumed by rail transit vehicles in urbanized area in kilowatt-hours
- VanKWH:Average daily amount of electricity consumed by van transit vehicles in urbanized area in kilowatt-hours
- BusCO2e: Average daily amount of carbon-dioxide equivalents produced by bus transit vehicles in urbanized area in grams
- RailCO2e: Average daily amount of carbon-dioxide equivalents produced by rail transit vehicles in urbanized area in grams
- VanCO2e: Average daily amount of carbon-dioxide equivalents produced by van transit vehicles in urbanized area in grams
- BusCO2eRate: Average amount of carbon-dioxide equivalents produced by bus transit vehicles per mile of travel in urbanized area in grams per mile
- RailCO2eRate: Average amount of carbon-dioxide equivalents produced by rail transit vehicles per mile of travel in urbanized area in grams per mile
- VanCO2eRate: Average amount of carbon-dioxide equivalents produced by van transit vehicles per mile of travel in urbanized area in grams per mile
11.6 Installation of VisionEval and VE-State
VE-State and VisionEval framework are implemented in R, a statistical programming language and environment. Both R and VisionEval are open source and freely available. For running VE-State you need to follow these steps:
- Install R (users are encouraged to also install RStudio, a free and open-source integrated development environment for R)
- Install VisionEval
- Run VE-State
The VisionEval installer is available here. Follow the instructions on this page carefully to install the VisionEval on your system.
11.7 In Brief: Running VE-State Base Scenario
See the VisionEval Getting Started documentation for an overview of the framework methods for running models and querying results.
- Double-click
VisionEval.Rprojin the location where you installed VisionEval. This will launch RStudio. - Enter
statemod <- openModel('VE-State') - Enter
statemod$run()
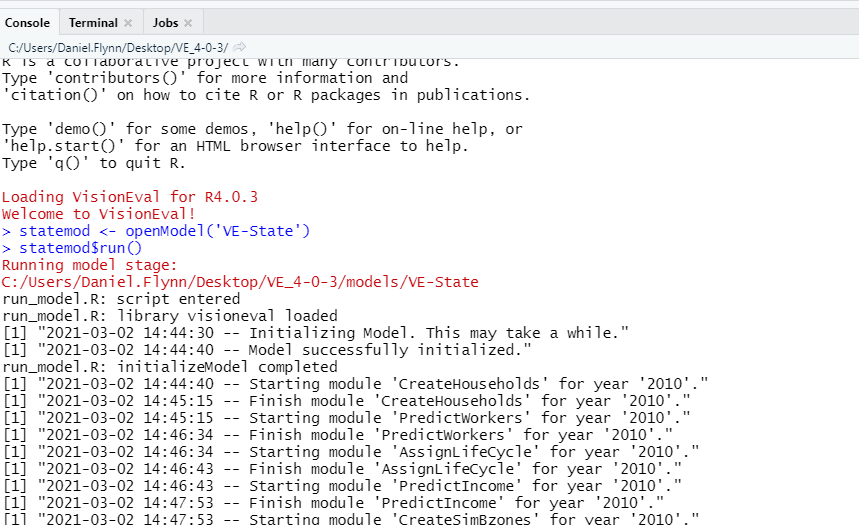
11.8 In Detail: Running VE-State Base Scenario
11.8.1 Preparing inputs
Once VisionEval and VE-State have been installed, a directory with sample data will be available at ../models/VE-State/. (Note .. refers to the parent directory of the unzipped installer file).
The VE-State directory serves the dual purposes of providing sample data and serving as a template for local modification to other locations.
The ../models/VE-State/ directory contains sample input files for Oregon. These inputs can be modified or replaced to investigate the impacts of policy changes or to model a different state. The folder contains multiple files and subfolders:
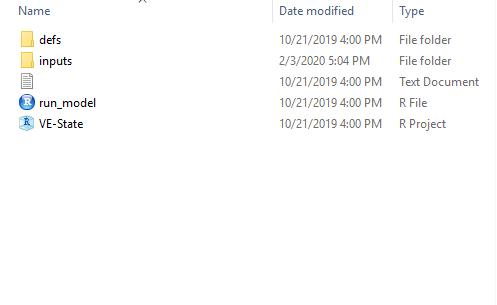
run_model.R is the core script for running the model. It consists of calls to the modules that make up the model. The user may modify the script to call the desired modules.
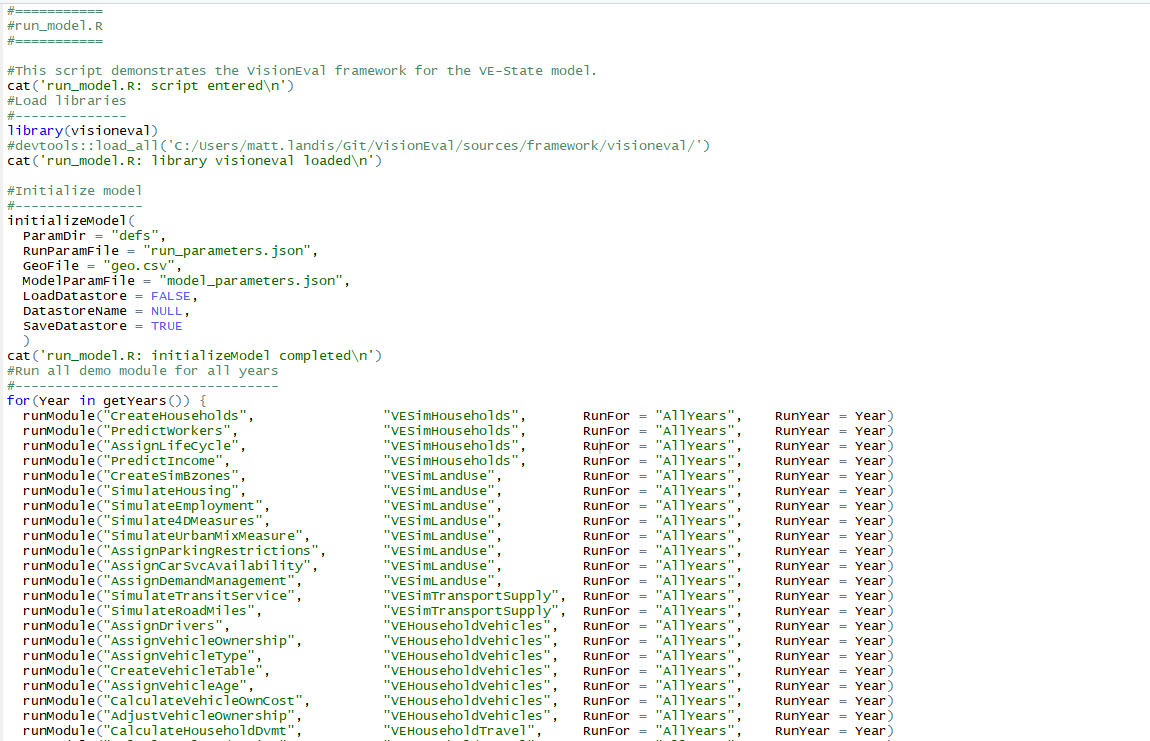
The defs directory contains five model definition files which is introduced in Model Definition Files
The inputs directory contains a number of CSV and JSON files that provide inputs for the modules. Each module specifies what input files it needs. If you would like to know
the description of each input file and how you can change those files for your desired testing see Inputs_and_Parameters
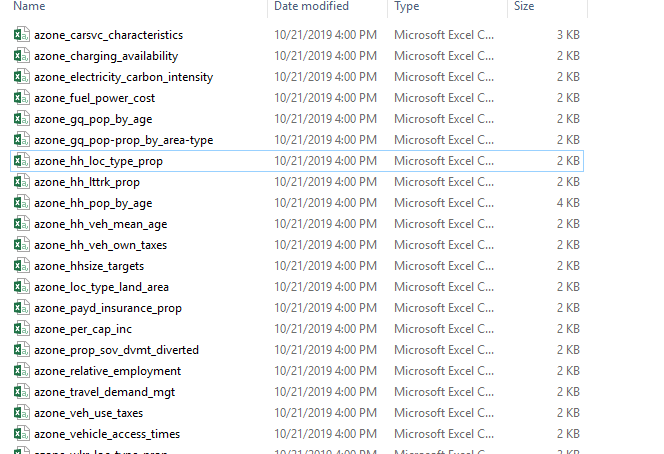
The ../models/VE-State directory contains sample input files for state of Oregon. These can be modified or replaced to investigate the impacts of policy changes or to model a different state.
11.8.2 Running the Model
There are multiple ways to run VisionEval models. VisionEval models can be run via the command line directly or using openModel, and can be run for one scenario or multiple scenarios in parallel. Results can be viewed in tabular form or with the interactive VEScenarioViewer.
- Start R (or RStudio) and make sure your directory is set to the installer folder. The easiest way to do this is to double-click
VisionEval.Rproj, which will be associated with RStudio if that is installed correctly. - You should see ‘Welcome to VisionEval!’ on the RStudio console. Then run the following commands:
statemod <- openModel('VE-State')
statemod$run()
By default this will run the model in ../models/VE-State/ directory. The default model is for Oregon, for 2010 and 2040.
After running the script you will see how the modules will be running in order.
The model run will take approximately 45 minutes. Once complete, the output are exported to ../models/VE-State/outputs in 3 different zone levels.
11.9 Querying results
To extract all results to .csv files, run:
statemod$extract()On the R console, you will see messages about what tables are being extracted and where the files are being saved, e.g.:
Extracting data for Table Azone in Group 2010
Extracting data for Table Bzone in Group 2010
Extracting data for Table Household in Group 2010
[...]
Write output file: /models/VE-State/output/Azone_2010_1_2021-03-02_153010.csv
Write output file: /models/VE-State/output/Bzone_2010_1_2021-03-02_153010.csv
[...]
For a state-wide model, the Household and Vehicle tables in particular can be quite large, and this full result extraction might take several minutes.
To extract just one field, for example DVMT at the household level for 2010 and 2040, first select just the Household table using the tablesSelected method:
statemod$tablesSelected <- 'Household'Then select the Dvmt field:
statemod$fieldsSelected <- 'Dvmt'Extract the result to a list of data frames for plotting, rather than to a .csv file. Some manipulation of the list can be done to put the fields in one data frame for plotting, for example:
hh_dvmt <- statemod$extract(saveTo = F)
hh_dvmt <- unlist(hh_dvmt)
year <- names(hh_dvmt)
year <- ifelse(grepl('2010', year), '2010', '2040')
hh_dvmt <- data.frame(year, Dvmt = hh_dvmt)
Plot using the ggplot2 library, for example:
ggplot(hh_dvmt, aes(x = Dvmt, fill = year)) +
  geom_histogram() +
  ylab('Number of Households') +
  ggtitle('Distribution of DVMT by VE-State for Oregon')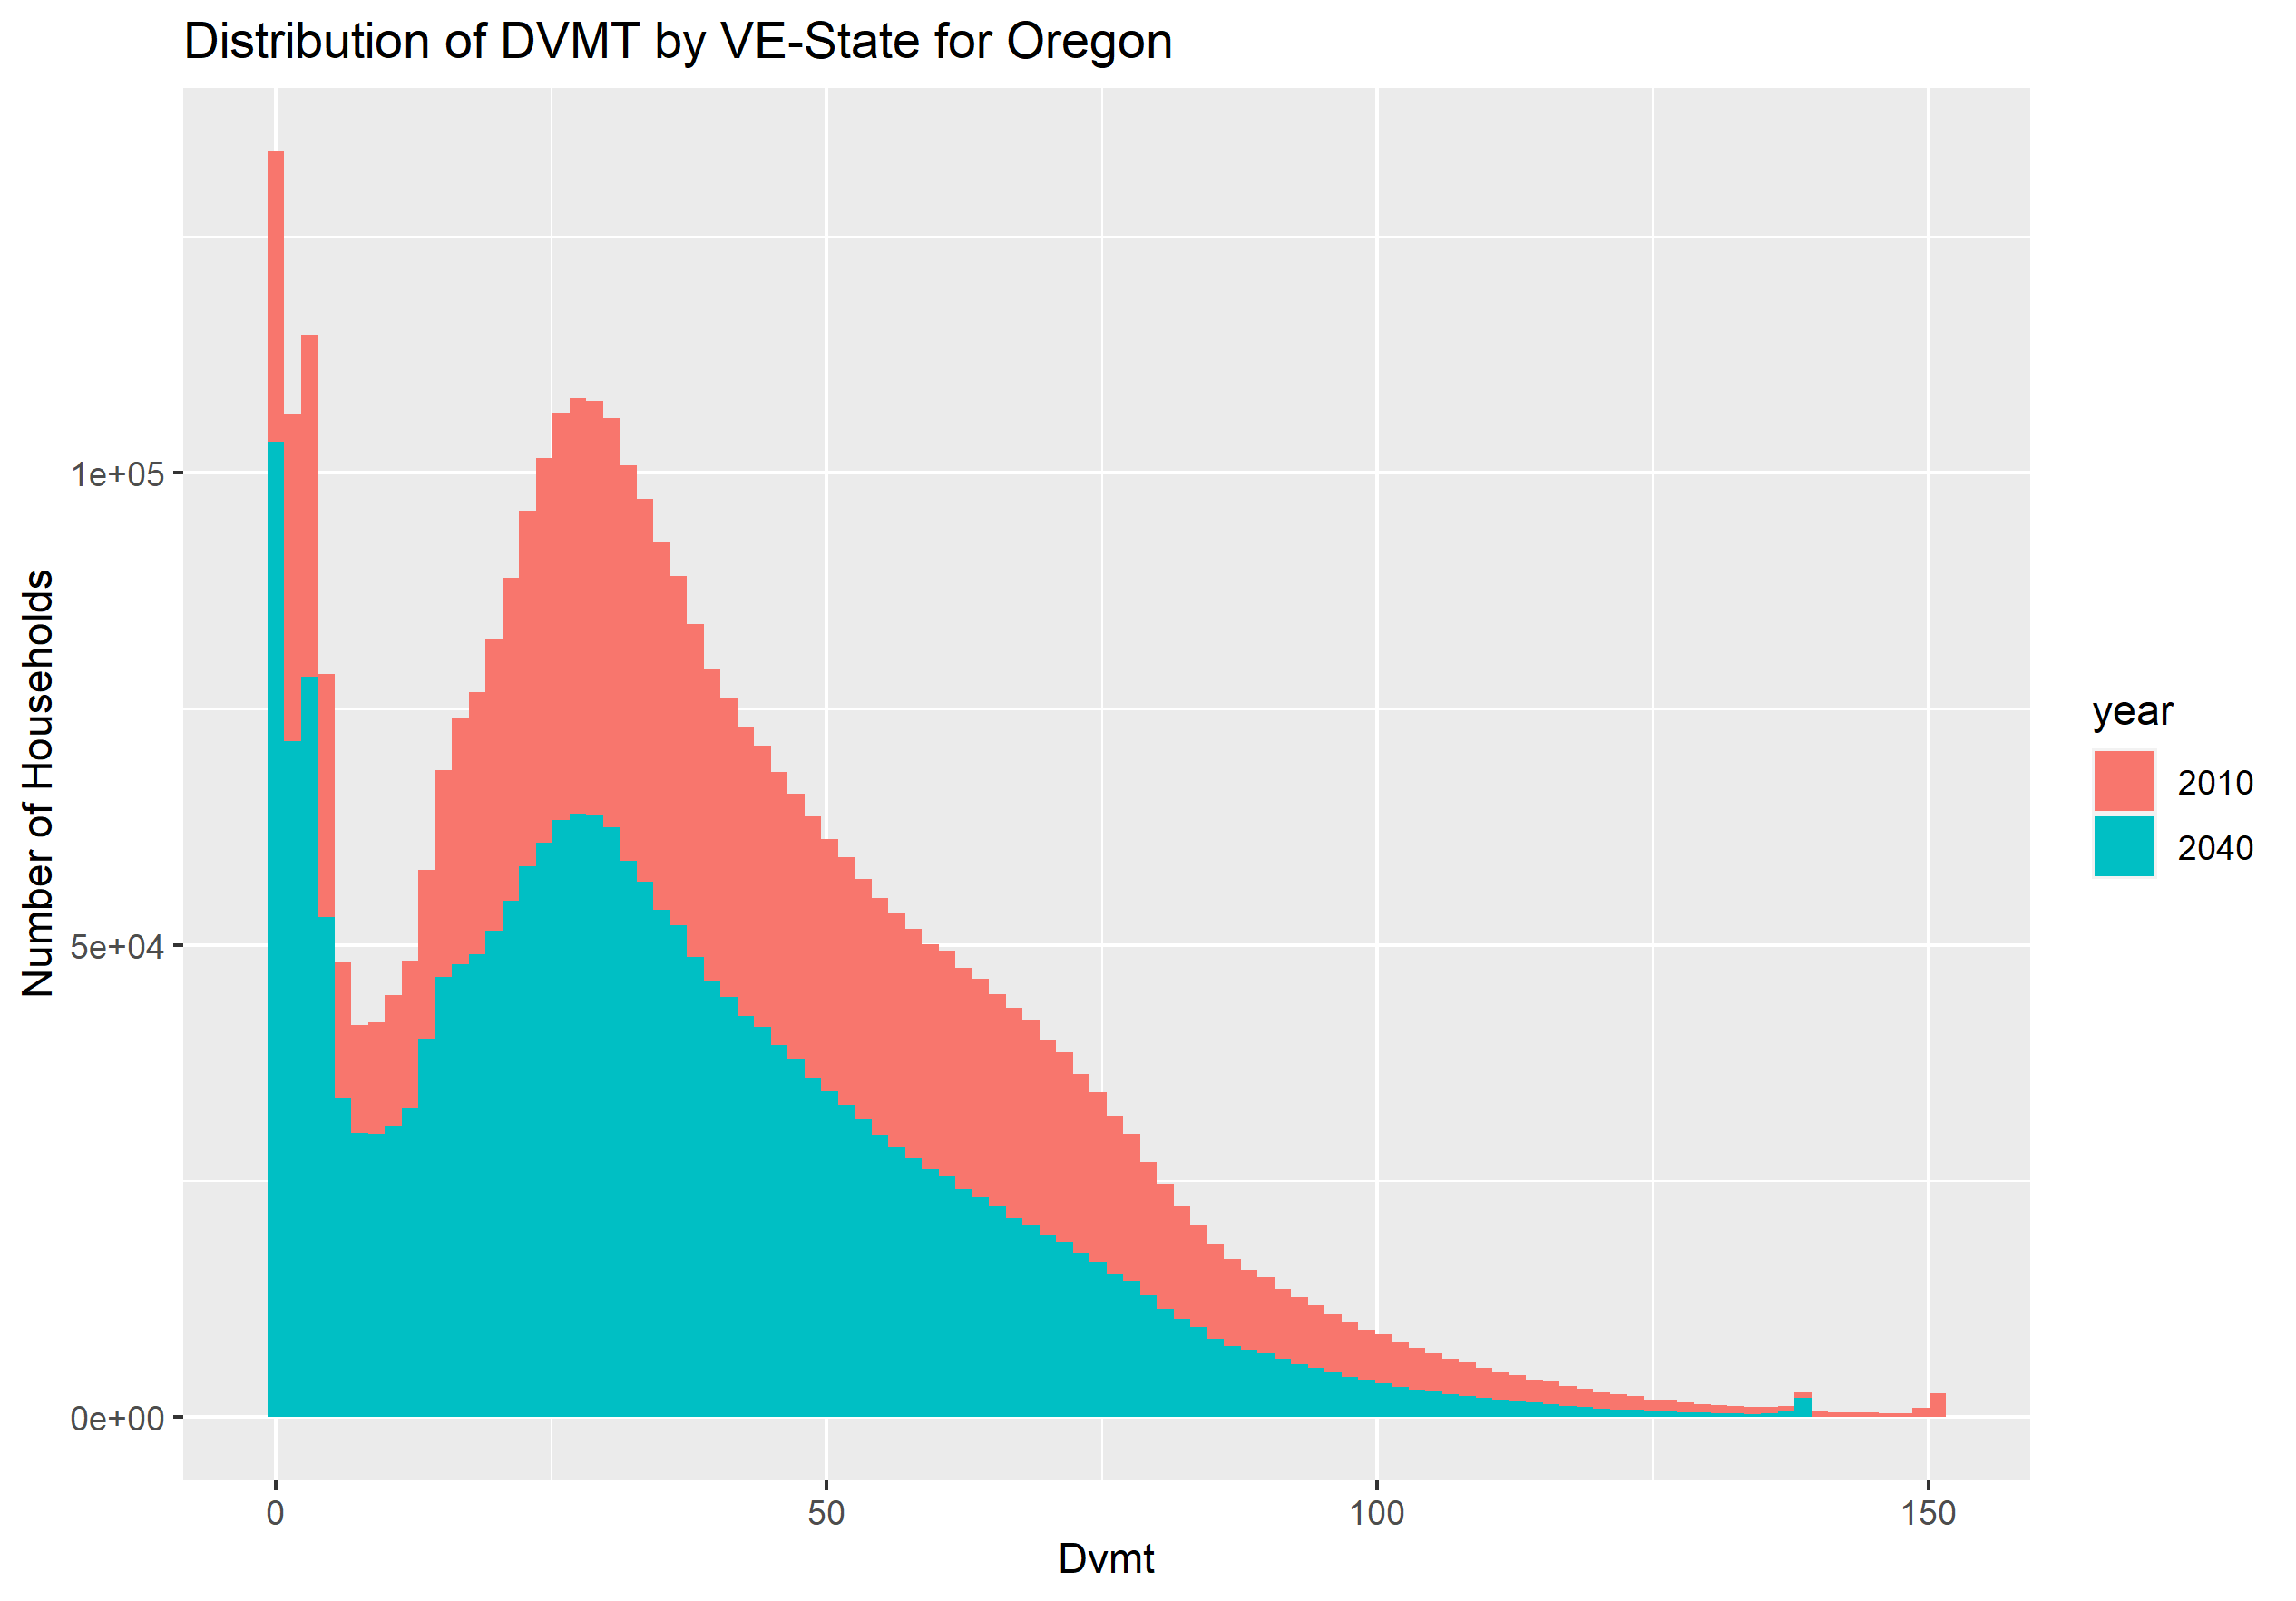
Other query methods are described in the Getting Started documentation.
11.9.1 Scenarios
To modify a scenario, the appropriate input files are edited. For example, to change the flat rate tax of vehicles for future azone_hh_veh_own_taxes.csv would be modified in Excel, LibreOffice, OpenOffice, or a text editor to change the VehOwnFlatRateFee of year 2038.

Create scenarios using the same steps as for VE-RSPM
Return to Tutorial.
11.11 Installation of VisionEval and VE-State
VE-State and VisionEval framework are implemented in R, a statistical programming language and environment. Both R and VisionEval are open source and freely available. For running VE-State you need to follow these steps:
- Install R (users are encouraged to also install RStudio, a free and open-source integrated development environment for R)
- Install VisionEval
- Run VE-State
The VisionEval installer is available here. Follow the instructions on this page carefully to install the VisionEval on your system.
11.12 In Brief: Running VE-State Base Scenario
See the VisionEval Getting Started documentation for an overview of the framework methods for running models and querying results.
- Double-click
VisionEval.Rprojin the location where you installed VisionEval. This will launch RStudio. - Enter
statemod <- openModel('VE-State') - Enter
statemod$run()
11.13 In Detail: Running VE-State Base Scenario
11.13.1 Preparing inputs
Once VisionEval and VE-State have been installed, a directory with sample data will be available at ../models/VE-State/. (Note .. refers to the parent directory of the unzipped installer file).
The VE-State directory serves the dual purposes of providing sample data and serving as a template for local modification to other locations.
The ../models/VE-State/ directory contains sample input files for Oregon. These inputs can be modified or replaced to investigate the impacts of policy changes or to model a different state. The folder contains multiple files and subfolders:
run_model.R is the core script for running the model. It consists of calls to the modules that make up the model. The user may modify the script to call the desired modules.
The defs directory contains five model definition files which is introduced in Model Definition Files
The inputs directory contains a number of CSV and JSON files that provide inputs for the modules. Each module specifies what input files it needs. If you would like to know
the description of each input file and how you can change those files for your desired testing see Inputs_and_Parameters
The ../models/VE-State directory contains sample input files for state of Oregon. These can be modified or replaced to investigate the impacts of policy changes or to model a different state.
11.13.2 Running the Model
There are multiple ways to run VisionEval models. VisionEval models can be run via the command line directly or using openModel, and can be run for one scenario or multiple scenarios in parallel. Results can be viewed in tabular form or with the interactive VEScenarioViewer.
- Start R (or RStudio) and make sure your directory is set to the installer folder. The easiest way to do this is to double-click
VisionEval.Rproj, which will be associated with RStudio if that is installed correctly. - You should see ‘Welcome to VisionEval!’ on the RStudio console. Then run the following commands:
statemod <- openModel('VE-State')
statemod$run()
By default this will run the model in ../models/VE-State/ directory. The default model is for Oregon, for 2010 and 2040.
After running the script you will see how the modules will be running in order.
The model run will take approximately 45 minutes. Once complete, the output are exported to ../models/VE-State/outputs in 3 different zone levels.
11.14 Querying results
To extract all results to .csv files, run:
statemod$extract()On the R console, you will see messages about what tables are being extracted and where the files are being saved, e.g.:
Extracting data for Table Azone in Group 2010
Extracting data for Table Bzone in Group 2010
Extracting data for Table Household in Group 2010
[...]
Write output file: /models/VE-State/output/Azone_2010_1_2021-03-02_153010.csv
Write output file: /models/VE-State/output/Bzone_2010_1_2021-03-02_153010.csv
[...]
For a state-wide model, the Household and Vehicle tables in particular can be quite large, and this full result extraction might take several minutes.
To extract just one field, for example DVMT at the household level for 2010 and 2040, first select just the Household table using the tablesSelected method:
statemod$tablesSelected <- 'Household'Then select the Dvmt field:
statemod$fieldsSelected <- 'Dvmt'Extract the result to a list of data frames for plotting, rather than to a .csv file. Some manipulation of the list can be done to put the fields in one data frame for plotting, for example:
hh_dvmt <- statemod$extract(saveTo = F)
hh_dvmt <- unlist(hh_dvmt)
year <- names(hh_dvmt)
year <- ifelse(grepl('2010', year), '2010', '2040')
hh_dvmt <- data.frame(year, Dvmt = hh_dvmt)
Plot using the ggplot2 library, for example:
ggplot(hh_dvmt, aes(x = Dvmt, fill = year)) +
  geom_histogram() +
  ylab('Number of Households') +
  ggtitle('Distribution of DVMT by VE-State for Oregon')
Other query methods are described in the Getting Started documentation.
11.14.1 Scenarios
To modify a scenario, the appropriate input files are edited. For example, to change the flat rate tax of vehicles for future azone_hh_veh_own_taxes.csv would be modified in Excel, LibreOffice, OpenOffice, or a text editor to change the VehOwnFlatRateFee of year 2038.
Create scenarios using the same steps as for VE-RSPM
Return to Tutorial.